
Long term trending of interface counters
To trend counters on an interface, simply click on Monitor>Interface and then enter the name of the device and the interface you want to monitor (see Figure 1).
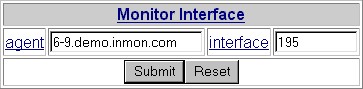 Figure 1 Monitor Interface Form
The resulting real-time interface chart (shown in Figure 2) displays interface counters over the last 60 minutes. The interval and granularity of the real-time counter display can be controlled by setting the intervals and interval size settings at the bottom of the chart.
Note: Real-time data is only maintained for a limited amount of time. The KeepActiveMinutes parameter controls the how long real-time data is maintained.
 Figure 2 Real-time statistics chart
An alternative way to access interface traffic charts is to navigate to the interface using the Monitor>Traffic view (see Drill-down to see sources of congestion).
Traffic Server maintains hourly summaries of interface counters as part of its history database. Typically traffic histories will be maintained for a period of 30-60 days before being deleted (the KeepHistoryDays parameter controls the data retention period). To access these longer term trends, simply click on one of the History links at the bottom left of the Real-time statistics chart (see Figure 2). For example, clicking on the Utilization link will generate a chart showing utilization over time.
 Figure 3 Long-term utilization trend
Figure 3 shows utilization plotted over a 24 hour period. Clicking on the buttons below the chart allow the plot interval to be changed.
There may be certain links that you would like to trend for very long periods, or where you would like to trend more counters. This more detailed trending of counters is typically required for WAN links. To help support this type of long term trending, Traffic Server provides integration with RRDTool. RRDTool is an open-source graphing and logging utility for time series data. RRD stands for Round-Robin Database and refers to the way in which the tool stores long term histories.
The first step in making use of RRDTool is to configure Traffic Server, identifying the interfaces that are to be monitored. Figure 4 shows an extract from a Traffic Server configuration file enabling RRD data collection on a particular interface (see Configuring Traffic Server to see how to modify and install new configurations).
[enterprise]
...
  [site]
  ...
    [zone]
    ...
      [subnet]
      ...
        [agent]
        address=10.10.13.1
        ...
          [port]
          ifIndex=12
          wan.enabled=YES
Figure 4 RRD configuration fileOnce the new configuration has been installed, detailed interface counter information will start being logged into the RRD databases. Clicking on the Routing>Traffic menu provides access to a graphical index of all the interfaces being monitored using RRDTool.
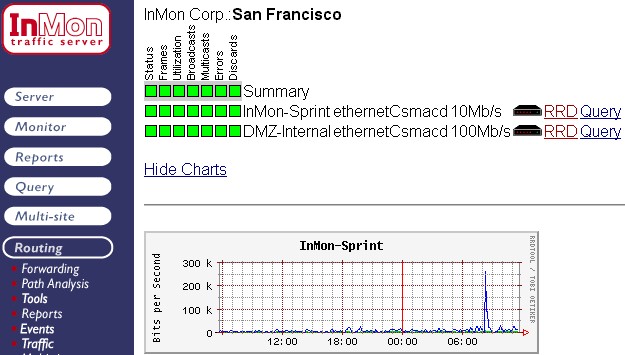 Figure 5 RRD index page
Figure 5 shows the RRD index page. Clicking on the numbered links at the top of the page jumps to the charts relating to the selected device. Clicking on any chart in the index brings up a detailed view of daily, weekly, monthly and yearly trends for that interface. Finally, clicking on a chart in one of these detailed views brings up additional counters that are being monitored for that interface (including broadcast, multicast, error and discard counters). Figure 6 shows a detailed breakdown of broadcast, multicast and unicast traffic.
 Figure 6 Detailed RRD chart showing packet counts
The main RRD index page isn't the only way to navigate to individual RRD charts. A link will be automatically created in the real-time interface counters view if RRD data is available for a particular interface (see the RRD link below the real-time chart shown in Figure 7).
 Figure 7 Detailed RRD chart showing packet counts
Finally, the a query is provided that will bring up RRD charts for a given agent and interface. The query form is accessed from the Query>Other>RRD menu (see Figure 8).
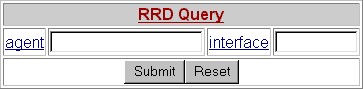 Figure 8 RRD query form
While the query form generates a page of RRD charts, it is also possible to embed an individual chart in your own web pages by accessing the query directly (see Help : Query : RRD). For example, Figure 9 shows how an image tag can be used to embed a trend chart within a document.
<html>
<head></head>
<body>
<p>Utilization on the site WAN link</p>
<img src="/its/query/RRDChart?action=chart&agent=10.10.13.1&interface=12">
</body>
</html>
Figure 9 Embedding an RRD chart in an html document
Traffic Server provides a way to define classes of traffic, called "Protocol Groups" (see Grouping traffic by protocol). Once named protocol groups have been defined, the rrd.services directive can be used to specify a set of protocol groups to plot (see Figure 10).
[enterprise]
  [site]
  rrd.services = TCP.web,TCP.login,TCP.file-transfer,TCP.privileged,TCP.X11
  ...
Figure 10 RRD Configuration File
The chart shown in Figure 11 shows a typical service breakdown trend for an interface. These charts are automatically computed for each interface being monitored using RRD.
 Figure 11 Service breakdown
| Related Topics |
|