
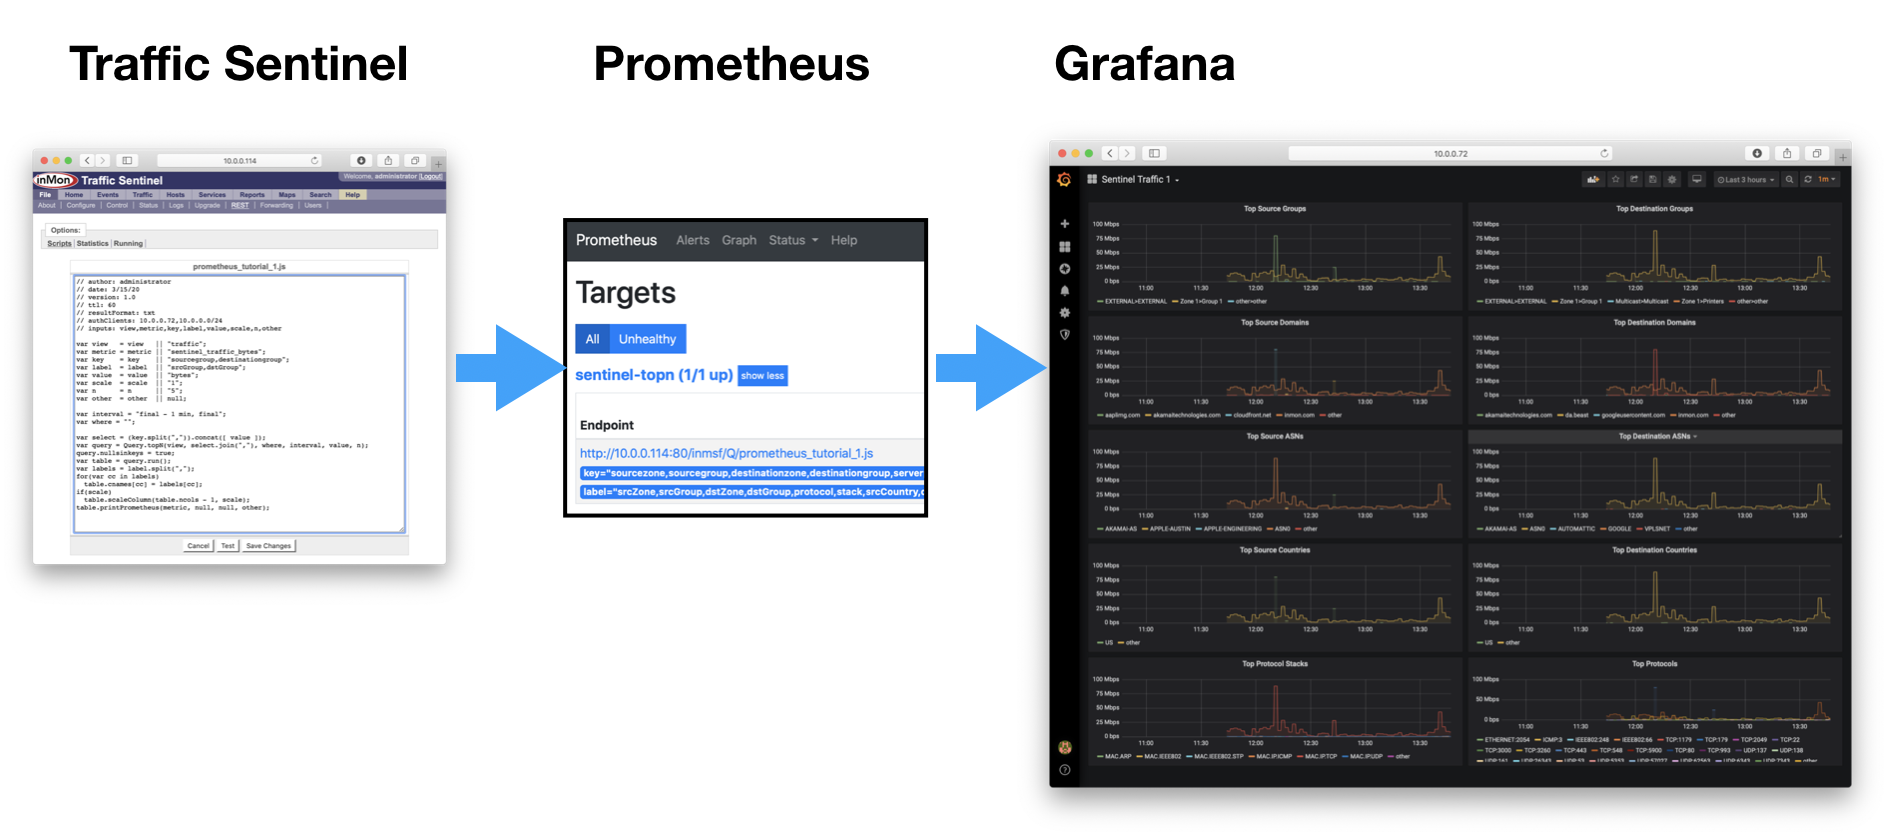
Exporting Data to Prometheus and Grafana
To merge data from Traffic Sentinel into dashboards that also display data from other sources you can export it into a time-series database such as Prometheus or Influx-DB. This tutorial will show you how to do that. To run this example you will need a system running Docker (which may be your laptop or desktop) that has access to your Traffic Sentinel server.
In these examples the IP addresses are:
- Traffic Sentinel = 10.0.0.114
- Prometheus Container = 10.0.0.72:9090
- Grafana Container = 10.0.0.72:3000
You will need to substitute your own IP addresses where directed below. If you run the Prometheus and Graphana docker containers on the same host as Traffic Sentinel then it may be convenient to add --network=host to the docker run command lines for the Prometheus and Graphana containers below. That way Graphana can find Prometheus and Prometheus can find Traffic Sentinel via 127.0.0.1 (localhost) rather than from a dynamically allocated docker container IP (e.g. 172.17.0.3) that may change on a restart.
1. Run Prometheus
On your Docker server, create a new directory called something like SentinelPrometheus and cd into it. Add the file prometheus.yml containing the following config, substituting the target IP of your Traffic Sentinel server:
global:
  scrape_interval:     60s
  evaluation_interval: 60s

rule_files:
  # - "first.rules"
  # - "second.rules"

scrape_configs:
  - job_name: 'sentinel-topn'
    metrics_path: /inmsf/Q/prometheus.js
    static_configs:
      - targets: ['10.0.0.114']
    params:
      view: ['traffic']
      metric: ['sentinel_traffic_bps']
      value: ['rate(bytes)']
      scale: ['8']
      key: ['sourcezone,sourcegroup,destinationzone,destinationgroup,serverport,protocolstack,country(sourceaddress),country(destinationaddress),name(asn(sourceaddress)),name(asn(destinationaddress)),domain(sourcename 2),domain(destinationname 2)']
      label: ['srcZone,srcGroup,dstZone,dstGroup,protocol,stack,srcCountry,dstCountry,srcAS,dstAS,srcDomain,dstDomain']
      n: ['10']
      other: ['other']
Add a persistent data volume to prometheus to use, like this:
sudo docker volume create prometheus-data
Still in the SentinelPrometheus directory, start the Prometheus database with this command:
sudo docker run --name prometheus --rm -v prometheus-data:/prometheus -v $PWD/prometheus.yml:/etc/prometheus/prometheus.yml -p 9090:9090 -d prom/prometheus
You should now be able to connect to Prometheus by substituting the IP address into this URL:
http://10.0.0.72:9090
Although this may require adding a firewall rule on the server before you can access it from your client browser. (e.g. ufw allow 9090/tcp)
Navigate to Status>Target Health and test the Scraper script by clicking on its EndPoint URL:
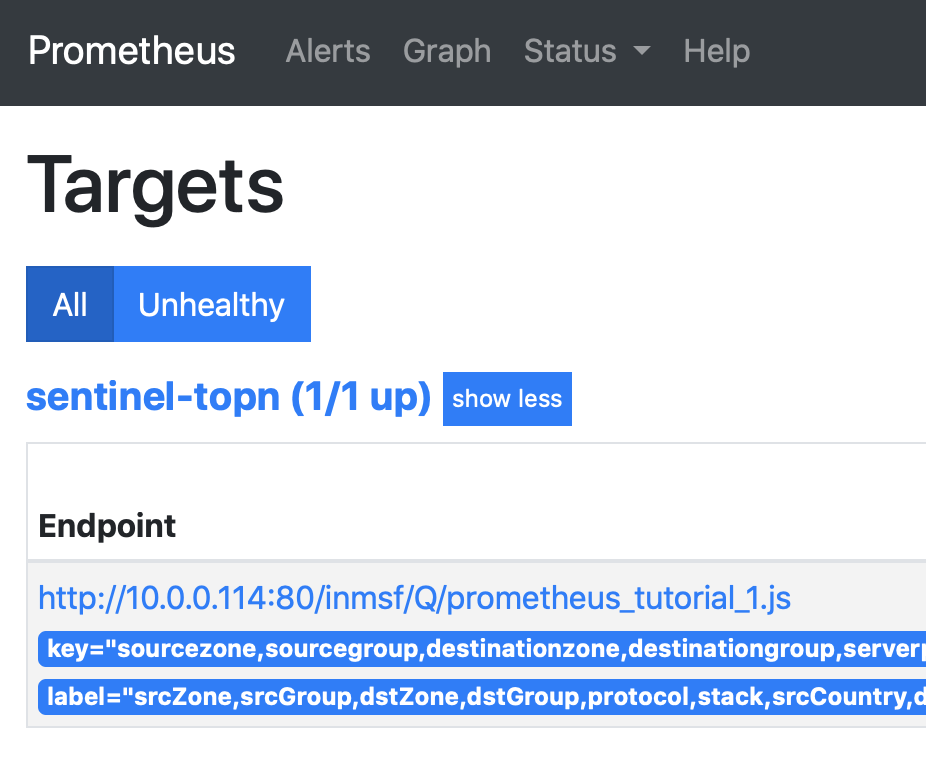
You may need to add your browser client IP to the "authClients" list in the prometheus.js script under File>REST in Traffic Sentinel, along with the client IP that the prometheus container will connect from. You should see something like this:
sentinel_traffic_bps{srcZone="Zone 1",srcGroup="Group 1",dstZone="Zone 1",dstGroup="Group 1",protocol="TCP:3260",stack="MAC.IP.TCP",srcCountry="other",dstCountry="other",srcAS="ASN0",dstAS="ASN0",srcDomain="inmon.com",dstDomain="inmon.com"} 3037440
sentinel_traffic_bps{srcZone="Zone 1",srcGroup="Group 1",dstZone="Zone 1",dstGroup="Group 1",protocol="UDP:6343",stack="MAC.IP.UDP",srcCountry="other",dstCountry="other",srcAS="ASN0",dstAS="ASN0",srcDomain="inmon.com",dstDomain="inmon.com"} 112604.8
sentinel_traffic_bps{srcZone="Zone 1",srcGroup="Group 1",dstZone="Multicast",dstGroup="Multicast",protocol="UDP:5353",stack="MAC.IP.UDP",srcCountry="other",dstCountry="other",srcAS="ASN0",dstAS="ASN0",srcDomain="inmon.com",dstDomain="other"} 57654.64
sentinel_traffic_bps{srcZone="Zone 1",srcGroup="Group 1",dstZone="Zone 1",dstGroup="Group 1",protocol="UDP:26343",stack="MAC.IP.UDP",srcCountry="other",dstCountry="other",srcAS="ASN0",dstAS="ASN0",srcDomain="other",dstDomain="inmon.com"} 39903.44
sentinel_traffic_bps{srcZone="Zone 1",srcGroup="Group 1",dstZone="Zone 1",dstGroup="Group 1",protocol="UDP:161",stack="MAC.IP.UDP",srcCountry="other",dstCountry="other",srcAS="ASN0",dstAS="ASN0",srcDomain="inmon.com",dstDomain="other"} 5056.264
sentinel_traffic_bps{srcZone="Zone 1",srcGroup="Group 1",dstZone="Zone 1",dstGroup="Group 1",protocol="ICMP:3",stack="MAC.IP.ICMP",srcCountry="other",dstCountry="other",srcAS="ASN0",dstAS="ASN0",srcDomain="inmon.com",dstDomain="inmon.com"} 3826.4
sentinel_traffic_bps{srcZone="EXTERNAL",srcGroup="EXTERNAL",dstZone="EXTERNAL",dstGroup="EXTERNAL",protocol="ETHERNET:2054",stack="MAC.ARP",srcCountry="other",dstCountry="other",srcAS="ASN0",dstAS="ASN0",srcDomain="other",dstDomain="other"} 0
Prometheus will now be collecting data from Traffic Sentinel every minute. You can confirm this, and check the performance, by visiting the File>REST>Statistics page on Traffic Sentinel.
2. Run Grafana
Add another persistent data volume for Grafana to use:
sudo docker volume create grafana-dataand then run Grafana like this:
sudo docker run --name grafana -v grafana-data:/var/lib/grafana -p 3000:3000 -d grafana/grafana
You can now connect to Grafana by substituting your IP into this URL:
http://10.0.0.72:3000
(if you had to add a firewall rule for 9090/tcp above, then you will probably need to repeat this for 3000/tcp here.)
and log in using the default user=admin pass=admin.
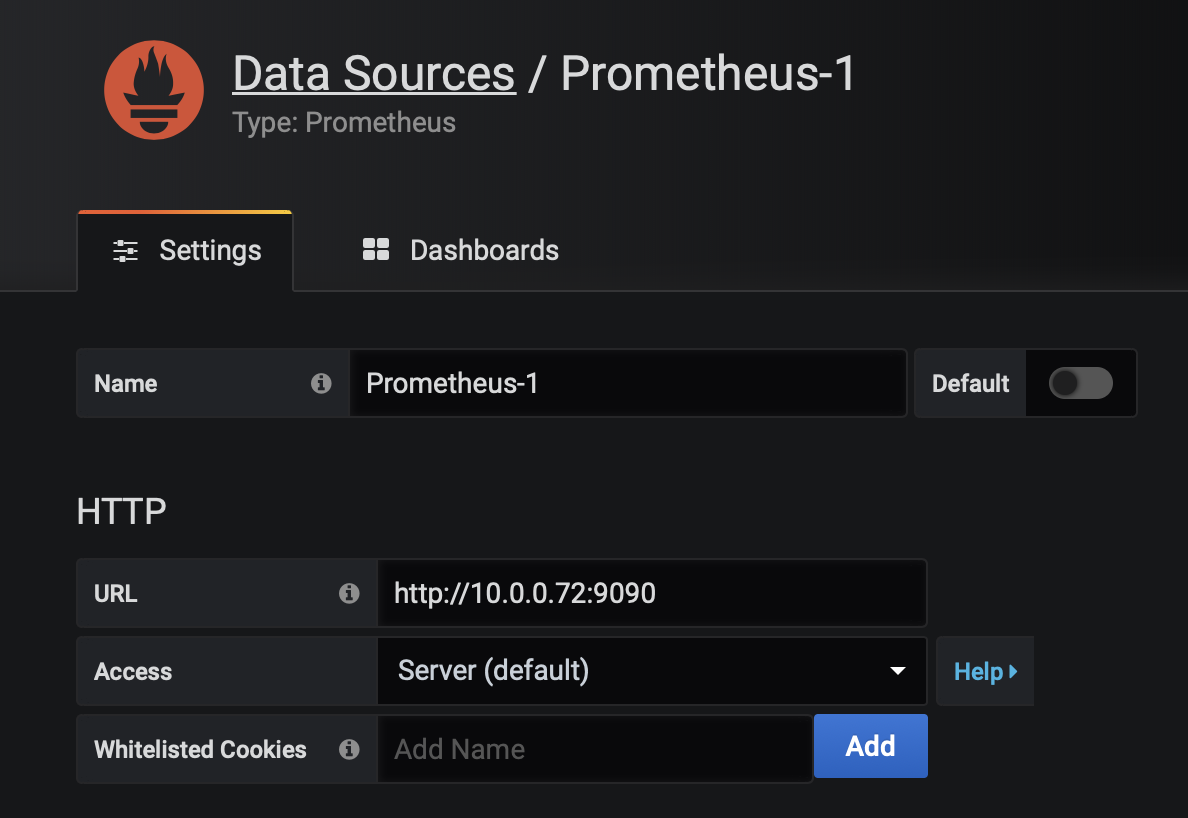
Click the icon for Connections > Data Sources to add the Prometheus data source. The URL for the data source will be the http://10.0.0.72:9090 URL that you connected to before:
3. Install Dashboard
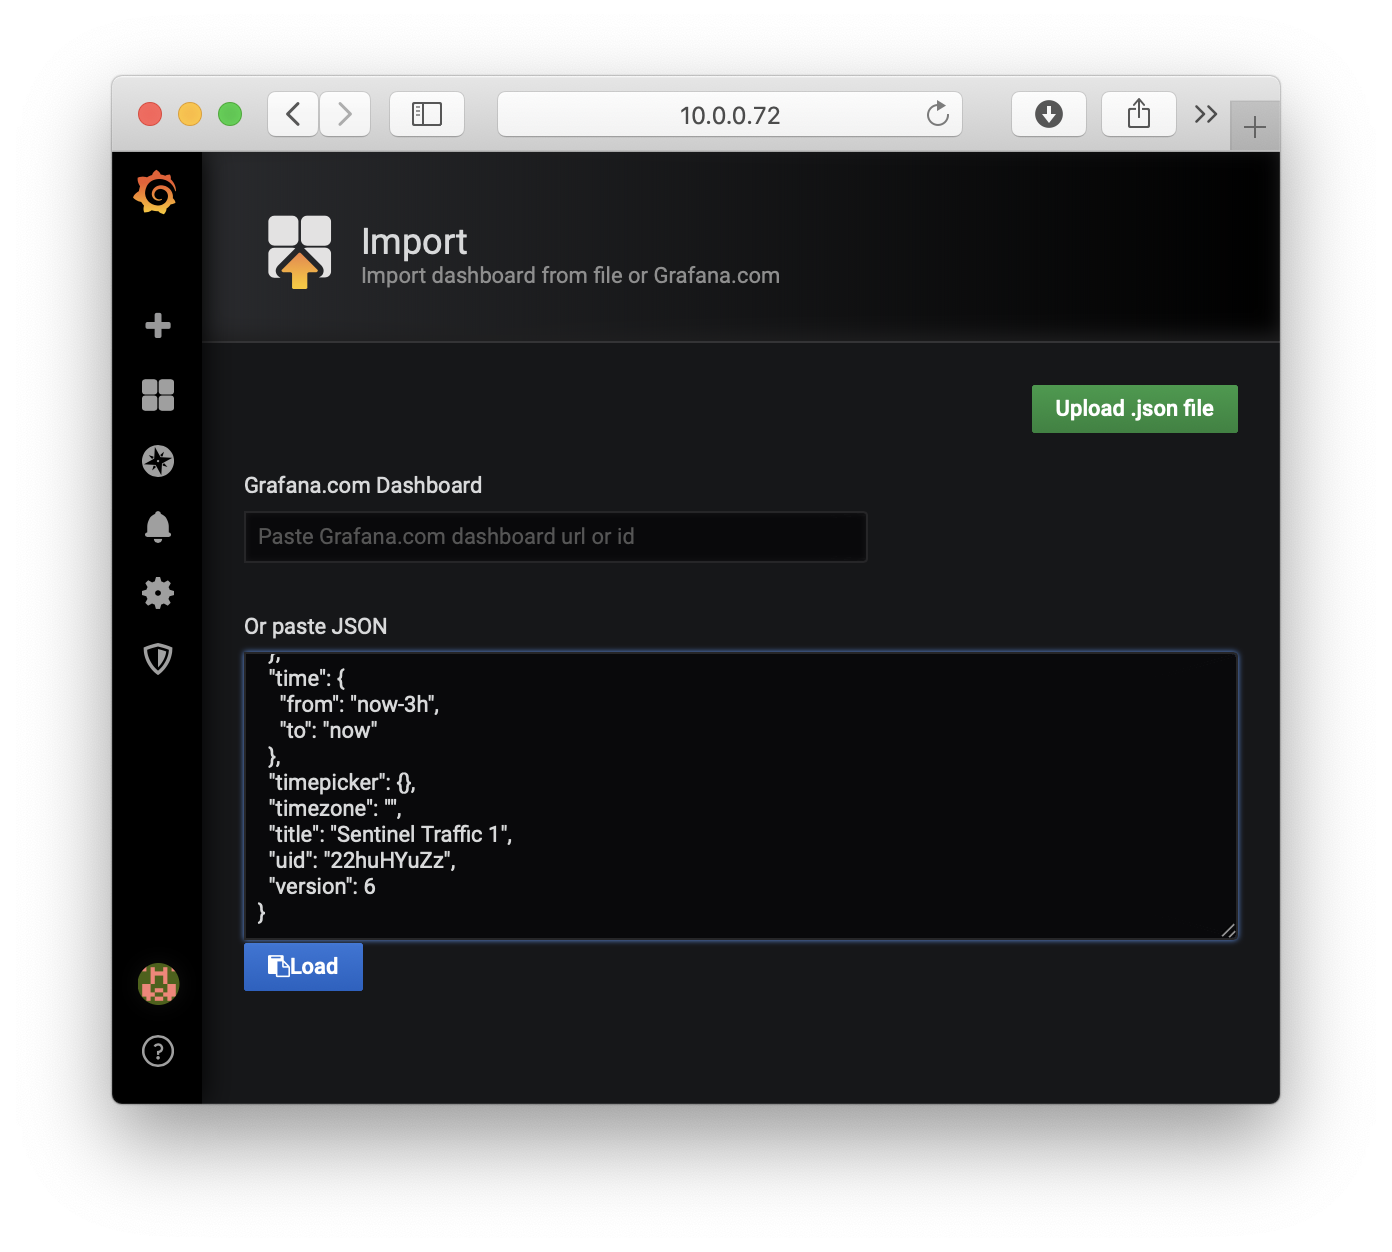
On the Graphana home page, click on the '+' at the top right and select Import Dashboard to install a pre-made dashboard by pasting the json spec from here and then clicking the Load button below.
On the next page assign the Prometheus data source and click Import.
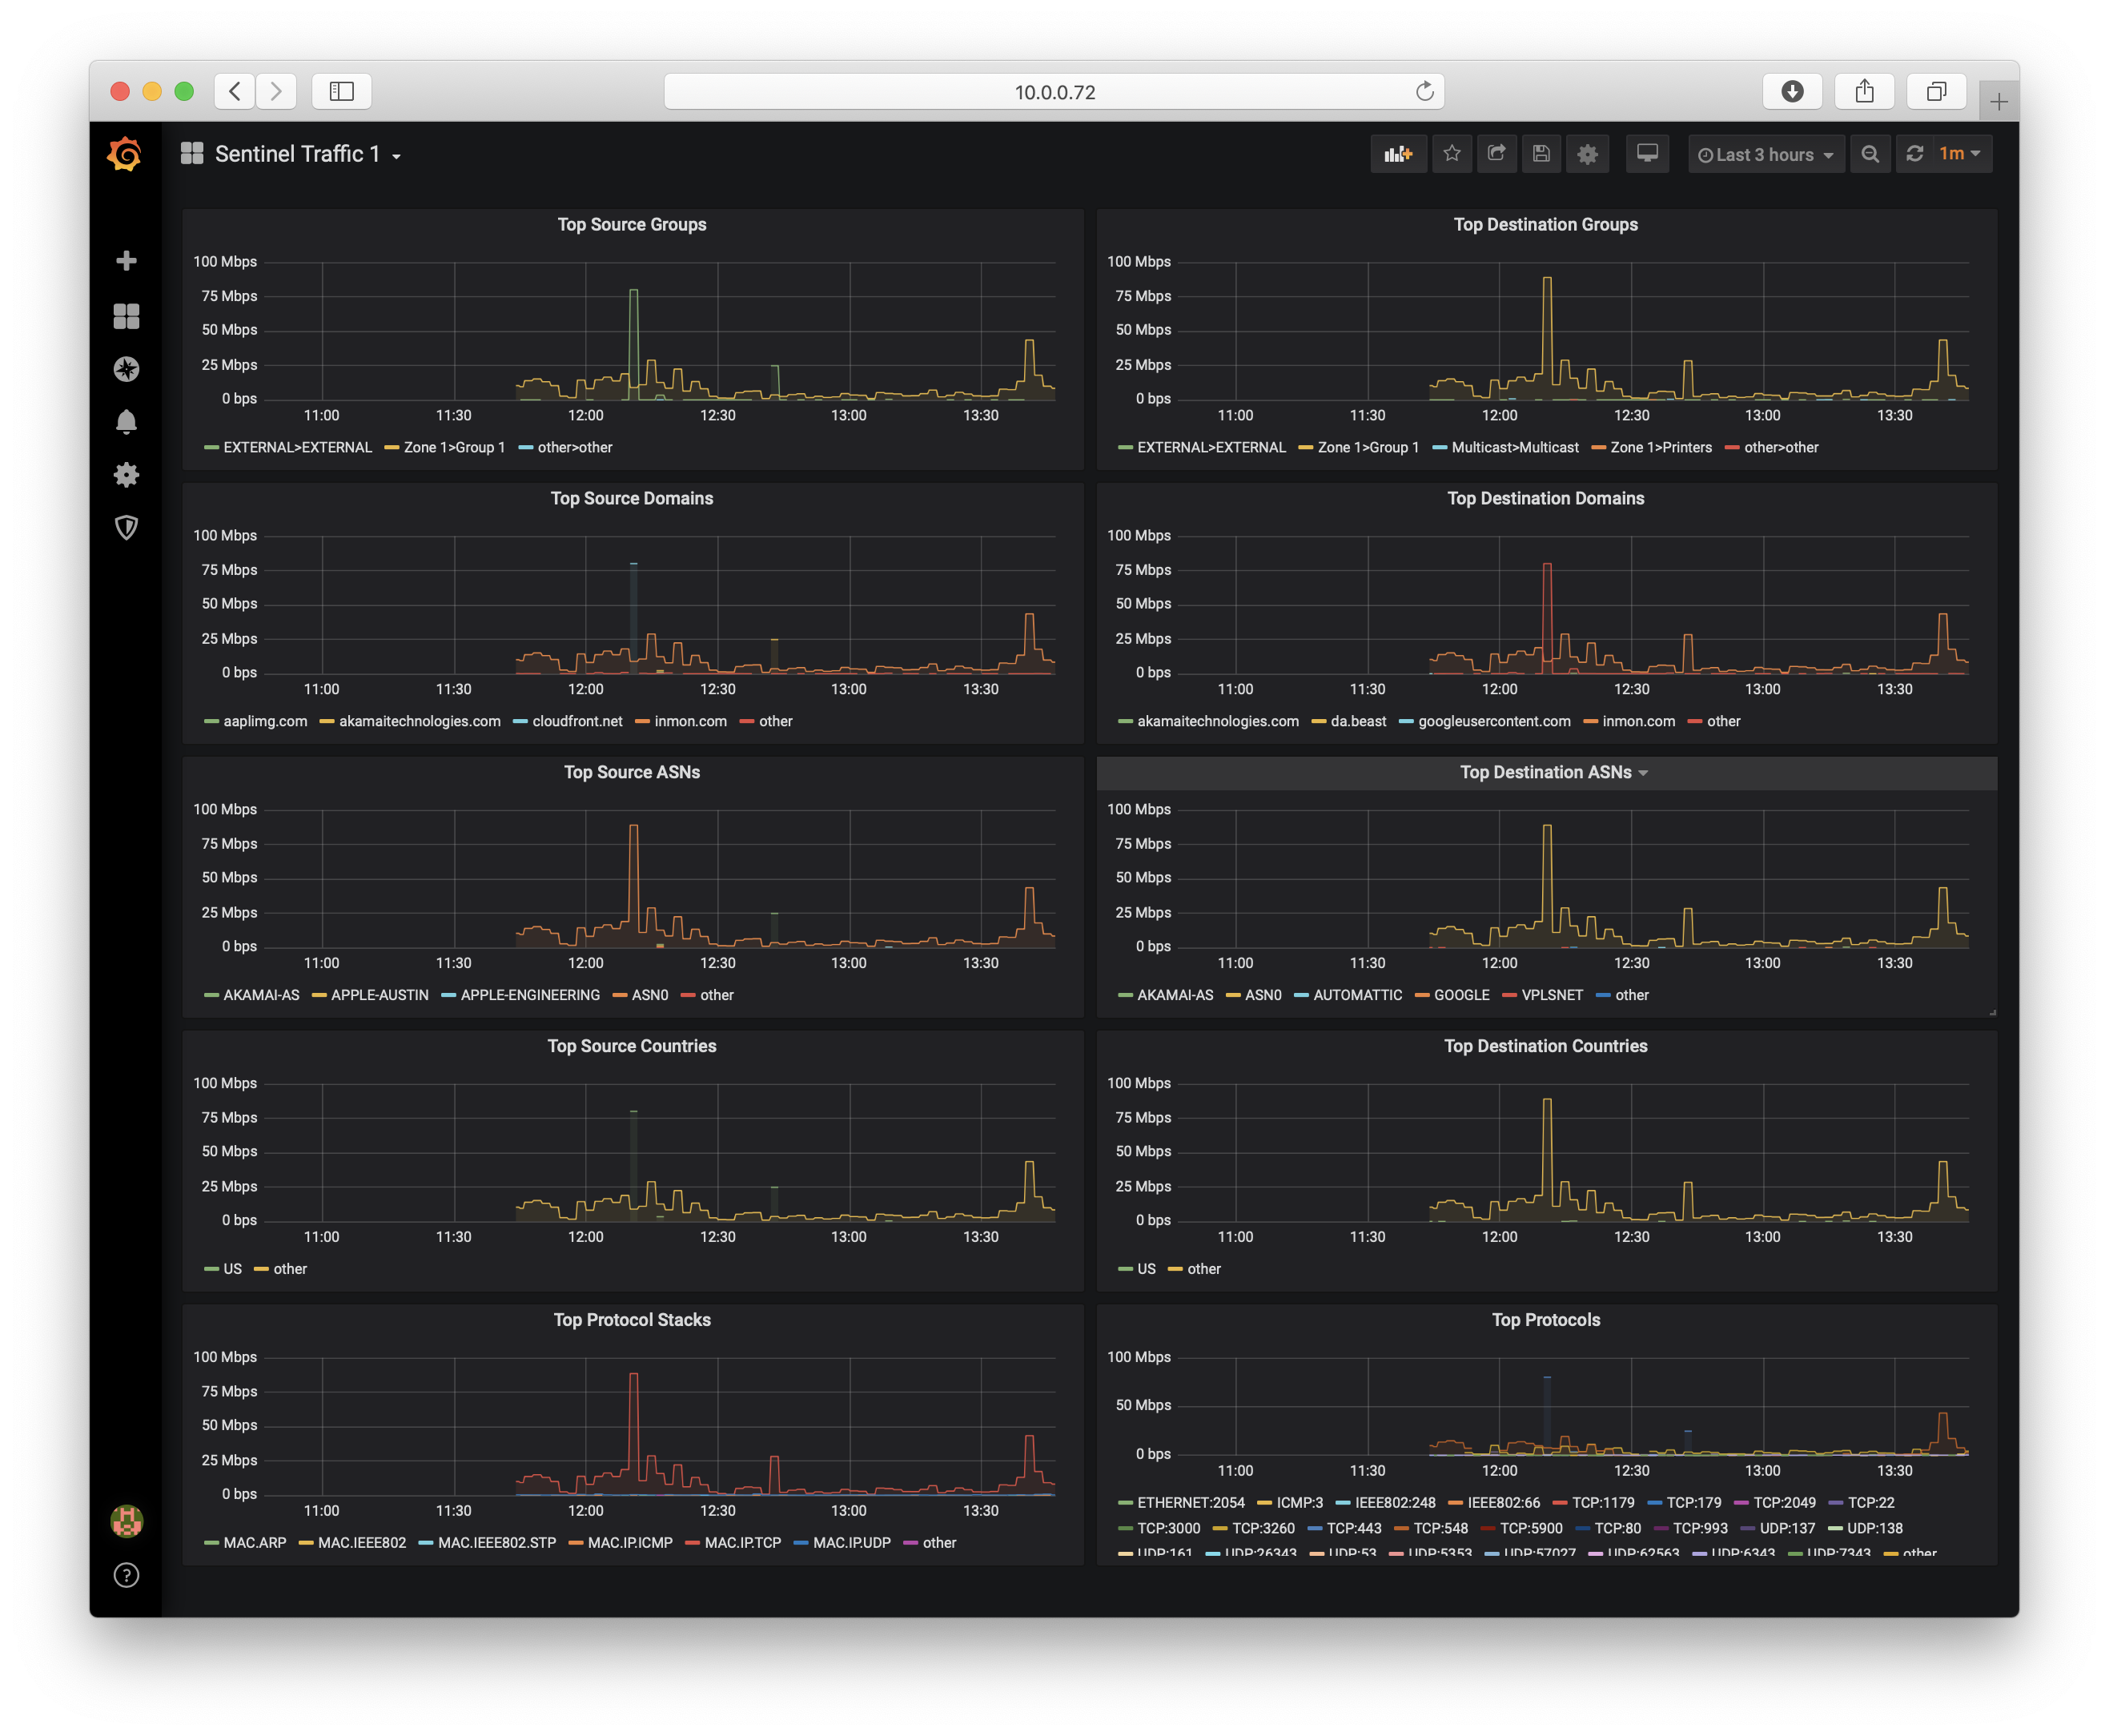
The result should be a dashboard looking like this that updates every minute:
4. Adding Dashboard Panels in Grafana
Now you are free to add additional dashboard panels using the metric sentinel_traffic_bps that was defined in the prometheus.yml configuration above. When you define chart panels you should set the value units to data(rate) / Bits/sec to match the numbers provided by the Traffic Sentinel script. The metric is broken out by a number of dimensions (labels), but you can roll sub-totals together when you define dashboard panels using an expression such as:
topk(10,sum(sentinel_traffic_bps) by (srcZone,srcGroup))
Note that the tokens in this expression are the metric name and the labels from the prometheus.yml file above.
5. Adding Metrics for Interface Counters and Host Counters
To make additional metrics available to Grafana you need only add more jobs to the prometheus.yml config file and then restart the Prometheus container. So the sequence looks like this:
docker stop prometheus
### edit prometheus.yml ###
docker run --name prometheus --rm -v $PWD/data:/prometheus -v $PWD/prometheus.yml:/etc/prometheus/prometheus.yml -p 9090:9090 -d prom/prometheus
Below is an expanded prometheus.yml file that uses the same Traffic Sentinel File>REST script to extract a subset of the interface counters and host counters every minute:
global:
  scrape_interval:     60s
  evaluation_interval: 60s

rule_files:
  # - "first.rules"
  # - "second.rules"

scrape_configs:
  - job_name: 'sentinel-topn'
    metrics_path: /inmsf/Q/prometheus_query.js
    static_configs:
      - targets: ['10.0.0.114']
    params:
      view: ['traffic']
      metric: ['sentinel_traffic_bps']
      value: ['rate(bytes)']
      scale: ['8']
      key: ['sourcezone,sourcegroup,destinationzone,destinationgroup,serverport,protocolstack,country(sourceaddress),country(destinationaddress),name(asn(sourceaddress)),name(asn(destinationaddress)),domain(sourcename 2),domain(destinationname 2)']
      label: ['srcZone,srcGroup,dstZone,dstGroup,protocol,stack,srcCountry,dstCountry,srcAS,dstAS,srcDomain,dstDomain']
      n: ['10']
      other: ['other']
  - job_name: 'sentinel-counters'
    metrics_path: /inmsf/Q/prometheus_query.js
    static_configs:
      - targets: ['10.0.0.114']
    params:
      view: ['ifcounters']
      metric: ['sentinel_ifinoctets,sentinel_ifoutoctets,sentinel_ifinunicasts,sentinel_ifoutunicasts,sentinel_ifinmulticasts,sentinel_ifoutmulticasts,sentinel_ifinbroadcasts,sentinel_ifoutbroadcasts,sentinel_ifinerrors,sentinel_ifouterrors,sentinel_ifindiscards,sentinel_ifoutdiscards']
      value: ['ifinoctets,ifoutoctets,frames_in,frames_out,ifinmulticasts,ifoutmulticasts,ifinbroadcasts,ifoutbroadcasts,ifinerrors,ifouterrors,ifindiscards,ifoutdiscards']
      key: ['zone,group,agent,ifindex,name(agent),name(interface),ifalias']
      label: ['zone,group,agentIP,ifindex,agent,interface']
      over: ['1']
      where: ['ifalias!=""']
  - job_name: 'sentinel-host-counters'
    metrics_path: /inmsf/Q/prometheus_query.js
    static_configs:
      - targets: ['10.0.0.114']
    params:
      view: ['host']
      metric: ['loadAvg,CPU,MEM,DISK,TCP_retransmissions']
      value: ['load_one,cpu_util,mem_used_pc,diskpartmax,tcp_retrans_segs']
      key: ['zone,group,agent,hostname,os_release']
      label: ['zone,group,agentIP,host,os']
If you install this prometheus.yml file, substitute the correct target IP address, and restart the Prometheus container the new metrics will appear in the Grafana UI. Note that the filter
6. Explanation
The fields in each job-name section in the prometheus.yml file are used to assemble a URL, and the list of params become the variables passed with it. So the sentinel-host-counters job above will call the URL:
http://10.0.0.114/inmsf/Q/prometheus_query.js
and pass these parameters:
view=host&metric=loadAvg,CPU,MEM,DISK,TCP_retransmissions&value=load_one,cpu_util,mem_used_pc,diskpartmax,tcp_retrans_segs&key=zone,group,agent,hostname,os_release&label=zone,group,agentIP,host,os
Those parameters will become the variables in the File>REST script in Traffic Sentinel:
- view = Traffic Sentinel database view.
- value = the value fields for the Traffic Sentinel query as a comma-separated list.
- metric = Grafana names that you choose for those value fields (e.g. so you can prefix them with "sentinel_" to distinguish easily from other data sources).
- key = the key fields for the Traffic Sentinel query.
- label = Grafana label names that you choose for those key fields.
- scale = optional scale factors for the values.
- n = optional topN truncation. This typically only makes sense when there is just one value. It allows you to make queries that would otherwise return huge datasets and cause scalability problems in Prometheus.
- minval = optional minimum value. The script will only export data to Prometheus that exceeds this value.
- other = optional substitution string when a key result is otherwise null.
| Related Topics |
|