
Customizing the Dashboard
Dashboards assemble data from different tabs in the Traffic Sentinel user interface and from queries into a single page. There are multiple strategies for organizing charts into dashboards: a dashboard may be used to capture peformance metrics related to a service and the server and network resources it consumes, or dashboards can be created for different parts of the network.
Choosing a Home Dashboard
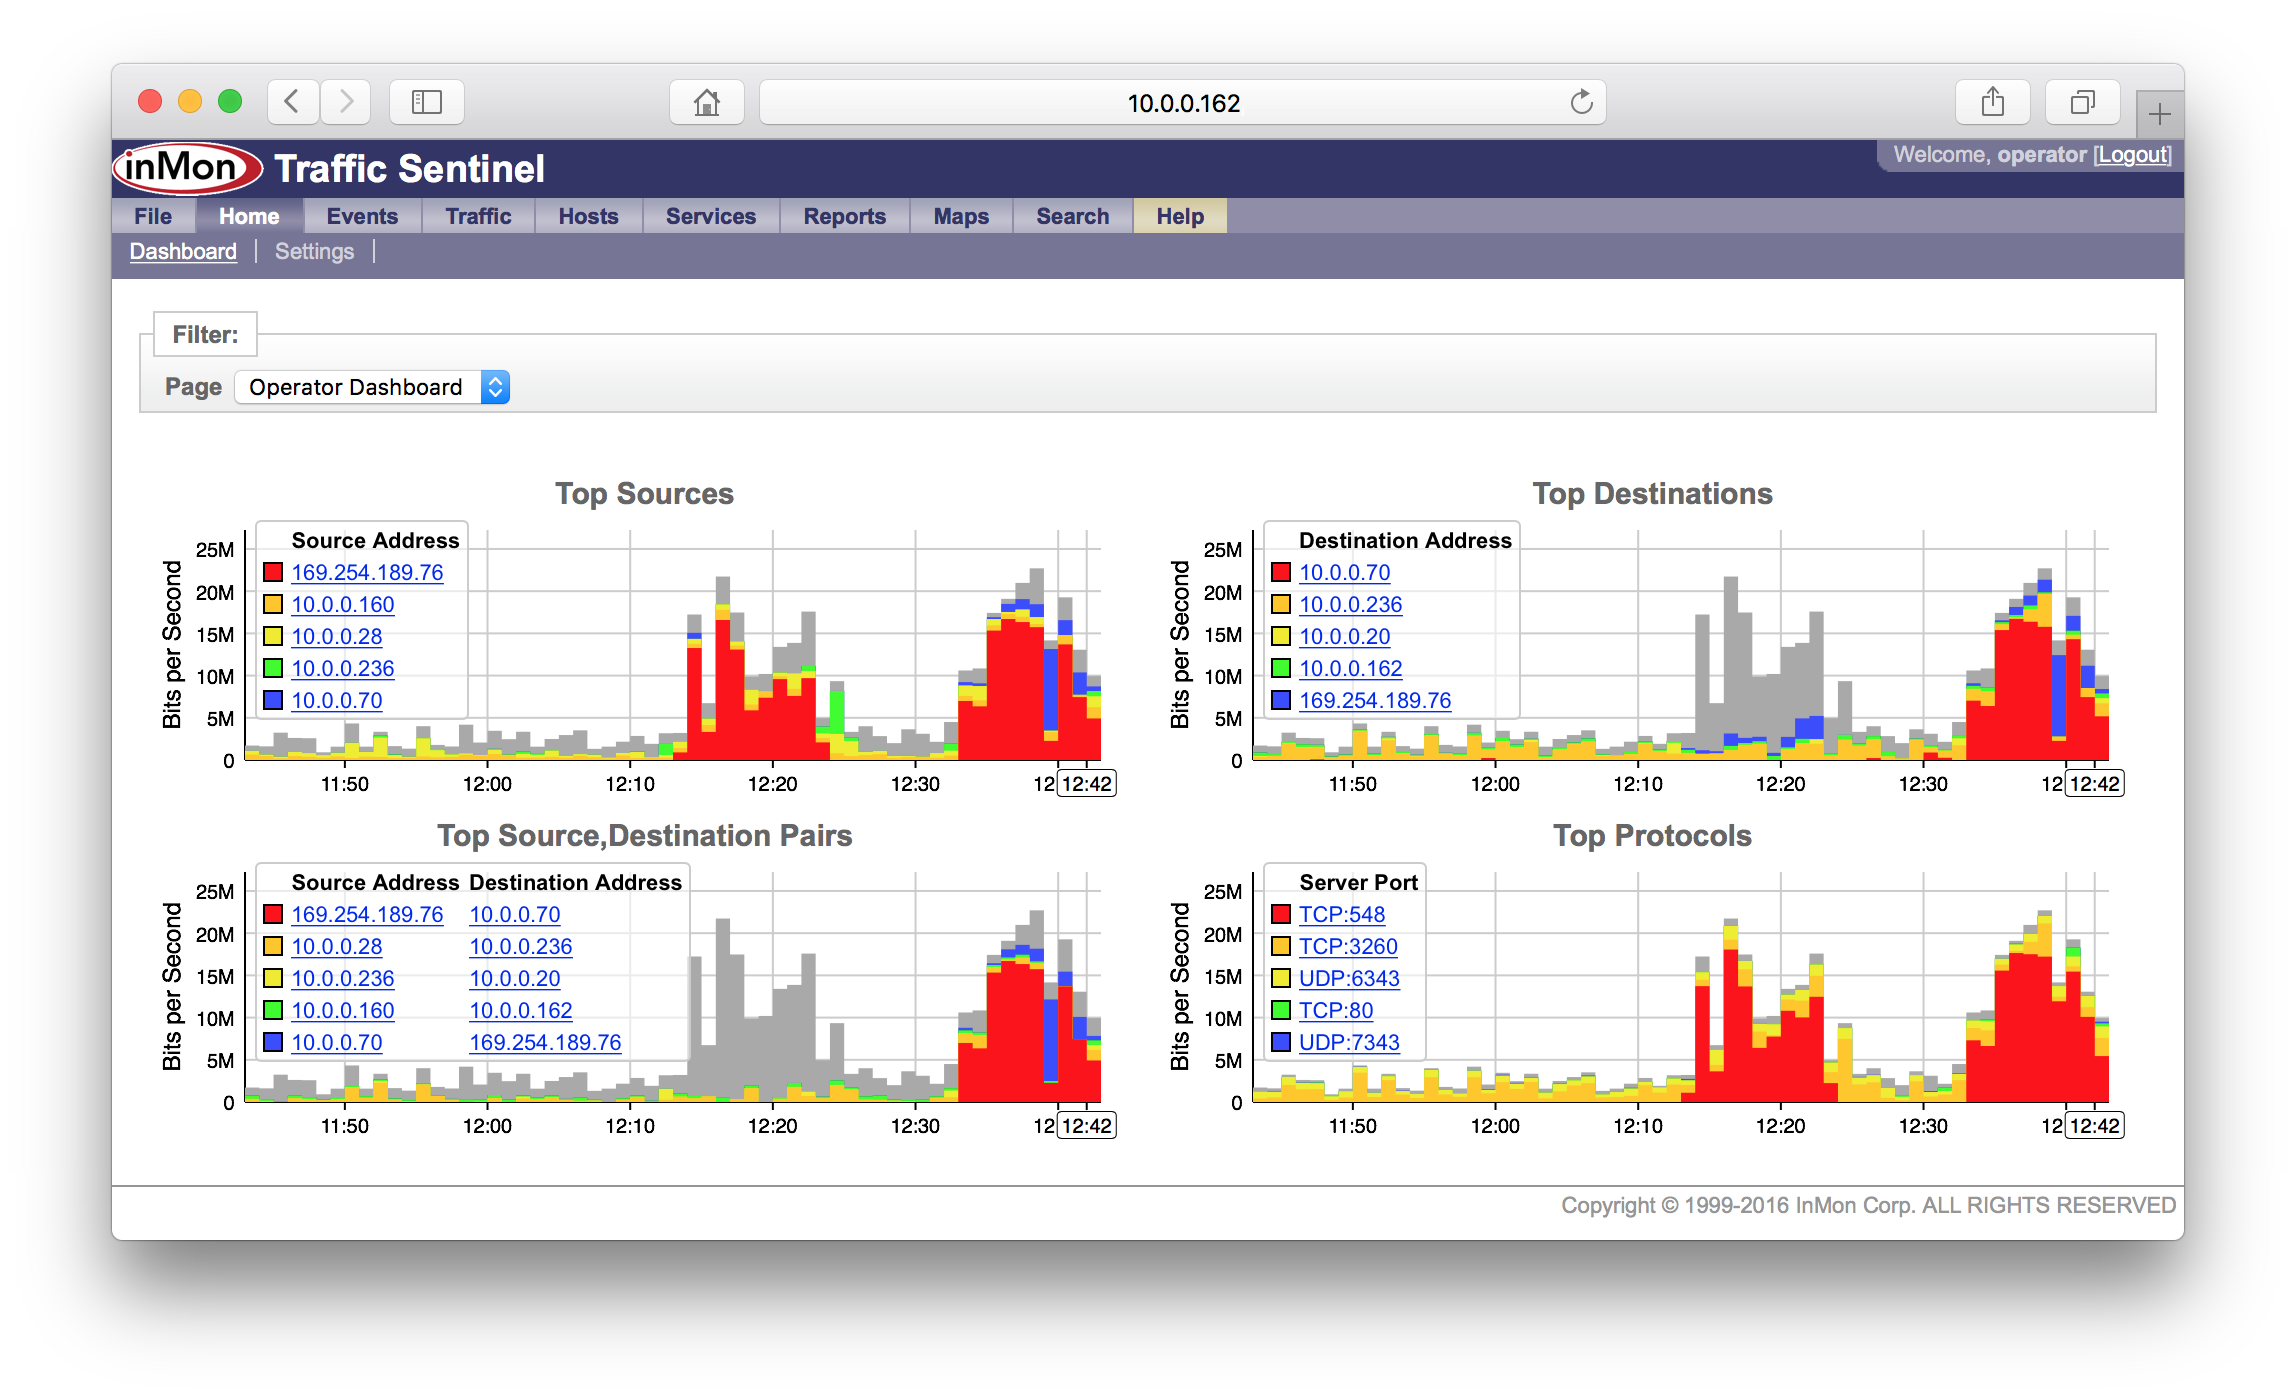
The Home>Dashboard page is the first page you see after logging into Traffic Sentinel. The Page selector in the Filter: bar is used to select among the dasbhoard pages that the user has permission to view. The last dashboard page viewed is remembered and will be the first dashboard you see when you next log in.
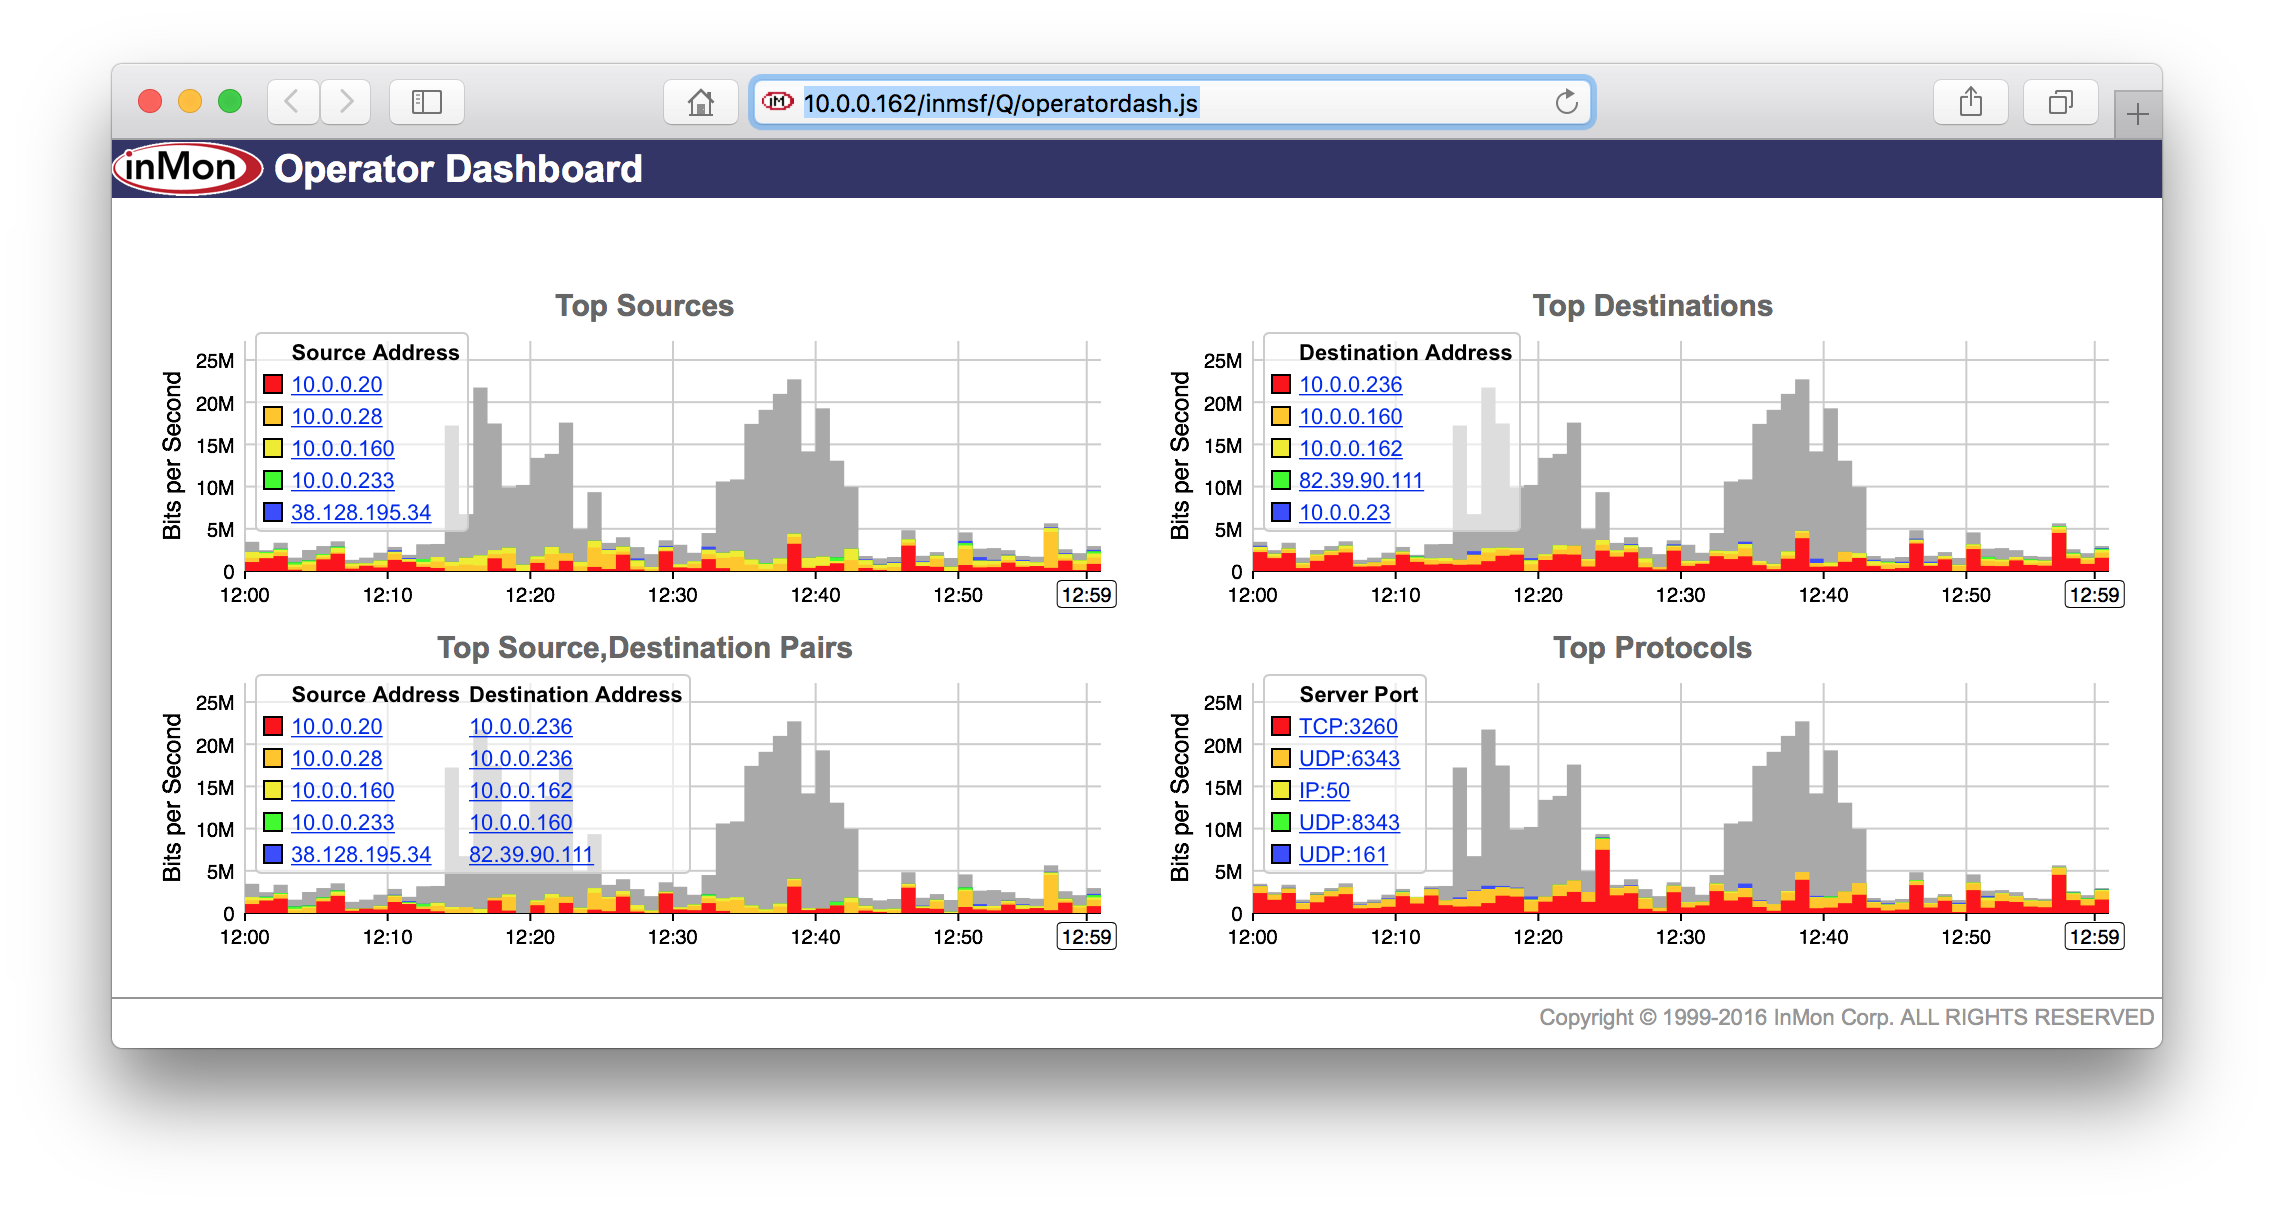
Building a custom dashboard
Access to the File>REST page is required to create or modify a dashboard (which typically requires admininistrative privileges). The REST API Builder tutorial provides additional information on editing and testing REST API scripts.
A dashboard is a special kind of REST script built to provide data to an HTML5 client running in a web browser.
// description: My First Dashboard
// author: My Name
// date: 1/28/16
// version: 1.0
// authLevel:operator
// clientJS:dashboard-2.0.js
// ttl: 60
// resultFormat: json

include('dashboard-2.0.js');

var trends  = new Trends({columns:2,interval:'last-60min,last'});

// add charts here
trends.addTrafficTopN({chart:'pairs'});
trends.addTrafficTopN({chart:'protocols'});

trends.printResult();
The authLevel setting can be set to guest, operator, or administrator, depending on the group of users that will be allowed to view the dashboard.
The clientJS:dashboard-2.0.js instructs Traffic Sentinel to include the Dashboard 2.0 html, javascript and style sheet components when the dashboard script is accessed. The client makes periodic queries to retreive JSON encoded data to display in the dashboard. The include('dashboard-2.0.js') statement loads the Trends object to help build the queries and return the data in the format that the client expects. The final printResult() runs the queries and return the results.
The easiest way to start is to Copy an existing dashboard that has elements that are close to what you want.
Interface Trend
Interface charts from the Traffic>Trend page:
trends.addInterfaceTrend({
  chart:'bytes',
  interface:'10.0.0.253>24',
  includeStatus: true
});
The interface parameter is required and specifies the switch port to trend. The easiest way to identify the IP address and ifIndex number used to identify a switch port is to navigate to the port using any of the tabs under Traffic. Click on the Agent Details button in the Filter: bar and the Search>Agent/Interface page will show the port id. The includeStatus option colors the heading to reflect the threshold status.
The following chart values are defined:
- utilization Utilization in / out switch port.
- bytes Bits/second in/out switch port.
- frames Frames/second in/out switch port.
- errors Errors/second in/out switch port.
- discards Discards/second in/out switch port.
Traffic TopN
Select charts from the Traffic>Top N page:
Either select a pre-defined Top N chart:
trends.addTrafficTopN({chart:'pairs'});
The following chart values are defined:
- sources Top source addresses
- destinationsTop destination addresses
- pairs Top source,destination address pairs
- protocols Top server ports
Or explicity specify the flow attributes:
trends.addTrafficTopN({
  keys:'sourceaddress,destinationaddress',
  value:'bps',
  title:'Top Pairs'
});
The keys attribute is a comma seperated list of keys that are valid for the traffic database view.
The following value options are defined:
- bps Bits per second
- Bps Bytes per second
- fps Frames per second
Include a where filter to select specific traffic, e.g. where:"ipsource=10.0.0.1"
Hosts Trend
Charts from the Hosts>Trend page:
trends.addHostTrend({chart:'loadavg'});
The follow chart values are defined:
- loadavg Load averages
- utilization CPU utilization
- processes Processes
- interrupts Interrupts
- memory Memory utilition
- swapping Swapping activity
- paging Paging activity
- iooperations Read/write operations
- iobytes Read/write bytes
- iotime Read/write times
- networkbytes Network bytes in/out
- networkpacketsNetwork packets in/out
- vutilization Virtual machine/container CPU utilization
- vmemory Virtual machine/container memory utilization
- viooperations Virtual machine/container read/write operations
- viobytes Virtual machine/container read/write bytes
- vnetworkbytes Virtual machine/container network bytes in/out
- vnetworkpackets Virtual machine/container network packets in/out
- jvmheap Java virtual machine heap memory size
- jvmnonheap Java virtual machine non-heap memory size
- jvmthreads Java virtual machine threads
- jvmgc Java virtual machine garbage collection
- jvmfd Java virtual machine open files
- jvmthreadsstarted Java virtual machine threads started
Include a where filter to select groups or individual hosts, e.g. where:"hostname=dns1"
Services Trend
Charts from the Services>Trend page:
trends.addServicesTrend({chart:'http_method'});
The following chart values are defined:
- http_method HTTP operations
- http_status HTTP status codes
- app_operations Application operations
- app_errors Application errors
- memcache_hitrate Memcache hit rate
- memcache_hits Memcache hits
- memcache_commands Memcache commands
- memcache_misses Memcache misses
- memcache_evictions Memcache evictions
- memcache_rwbytes Memcache read/write bytes
- memcache_bytes Memcache size
- memcache_connections Memcache connections
- memcache_items Memcache items
- memcache_curritems Memcache current items
- memcache_connectionrate Memcache connection rate
- memcache_yieldrate Memcache connection yield rate
- memcache_listendisabled Memcache connection listend disabled
- memcache_cmdflush Memcache flush commands
Include a where filter to select groups or individual hosts, e.g. where:"hostname~web.*"
Services TopN
Charts from Services>TopN page:
trends.addServicesTopN({
  keys:'uriextension',
  value:'ops',
  title:'HTTP File Types'
});
The following value options are defined:
- ops Operation per second
- duration Average duration
- bps Bits per second
- Bps Bytes per second
- fps Frames per second
Include a where filter to select groups or individual hosts, e.g. where:"hostname=web.*"
Trend
The utility functions described above simplify the creation of pre-defined trend charts. It is also possible to explicitly constuct the trend chart using the addTrend function and providing the paremeters for generating the data and the chart.
trends.addTrend({
  title:'Total Traffic',
  view:'traffic',
  select:'time,rate(bytes)',
  scale:8,
  step:true,
  legendHeadings:[],
  ylabel:'Bits per Second',
  type:'trend'
});
The following parameters are defined:
- view The database view, e.g. traffic, ifcounters, host, application
- select Comma separated list of fields to retrieve
- type Type of chart, e.g. trend, topn
- title Title for the chart
- ylabel Units label for chart
- scale Scale factor to apply to values
- where Filter to apply to query
- sort Field to sort results by
- ascending Boolean flag to reverse sort direction
- step Boolean flag to plot stepped value chart
- mirror Boolean flag to plot mirrored value chart, alternate values are plotted above and below the zero y-axis
- stack Boolean flag to stack values in plot
- colors Comma separated list of color values for trend lines
- legendHeadings Array of strings to label legend columns
- legendLinks Set to true to add Search links to legend items
- truncate Number of entries to keep in legend
- globaltruncate Boolean flag to show only the top keys over the whole interval
- includeother Boolean flag to include sum of other (non-legend) entries
For more information, see Scripting Queries
Scheduled Reports
Trend charts from the Reports>View page:
trends.addReportTrend({group:'base',report:'protocols',section:0,instance:1});
The following parameters must be specified:
- group The directory name containing the report template.
- report The name of the report template file.
- section The section number within the report template.
- instance The chart number within the section.
To find the parameters, navigate to the Report>View tab and drill down to a specific report. Click on the TXT, HTML, or Image link under the trend chart and note the query parameters in the URL. The query parameter names match the names in the addReportTrend() function and the values are required to include the trend chart in the dashboard.
Particle Vizualization
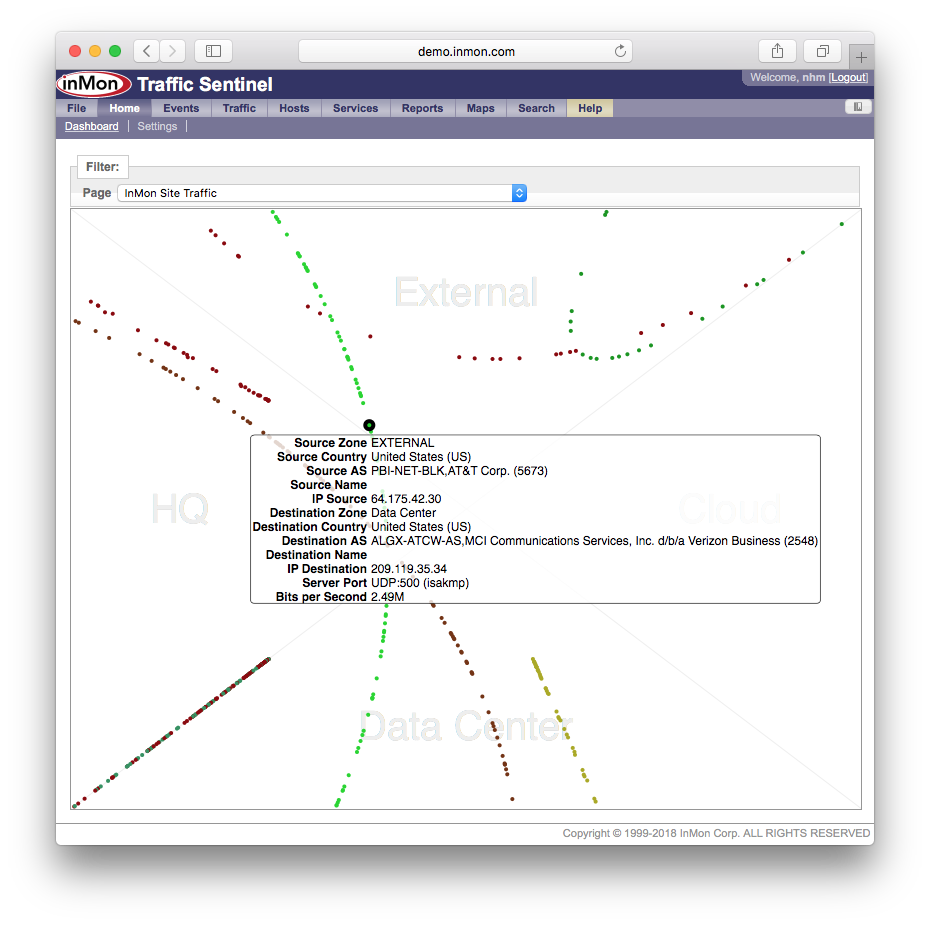
Traffic Sentinel ships with an example "particle.js" script. Make a Copy and edit the north, south, east and west axes to customize, using the Zones configured for your site, see Configuring Traffic Sentinel.
// description: InMon Site Traffic
// author: InMon
// date: 1/28/16
// version: 1.0
// authLevel:guest
// clientJS:flow-1.0.js
// ttl:60
// view:traffic
// resultFormat: json

include('flow-1.0.js');

new Flow({
  N:{zones:['EXTERNAL'],label:'External'},
  S:{zones:['Data Center'],label:'Data Center'},
  E:{zones:['Cloud'],label:'Cloud'},
  W:{zones:['HQ'],label:'HQ'},
  height:600,
  links:true
}).printResult();
Sankey Flow Vizualization
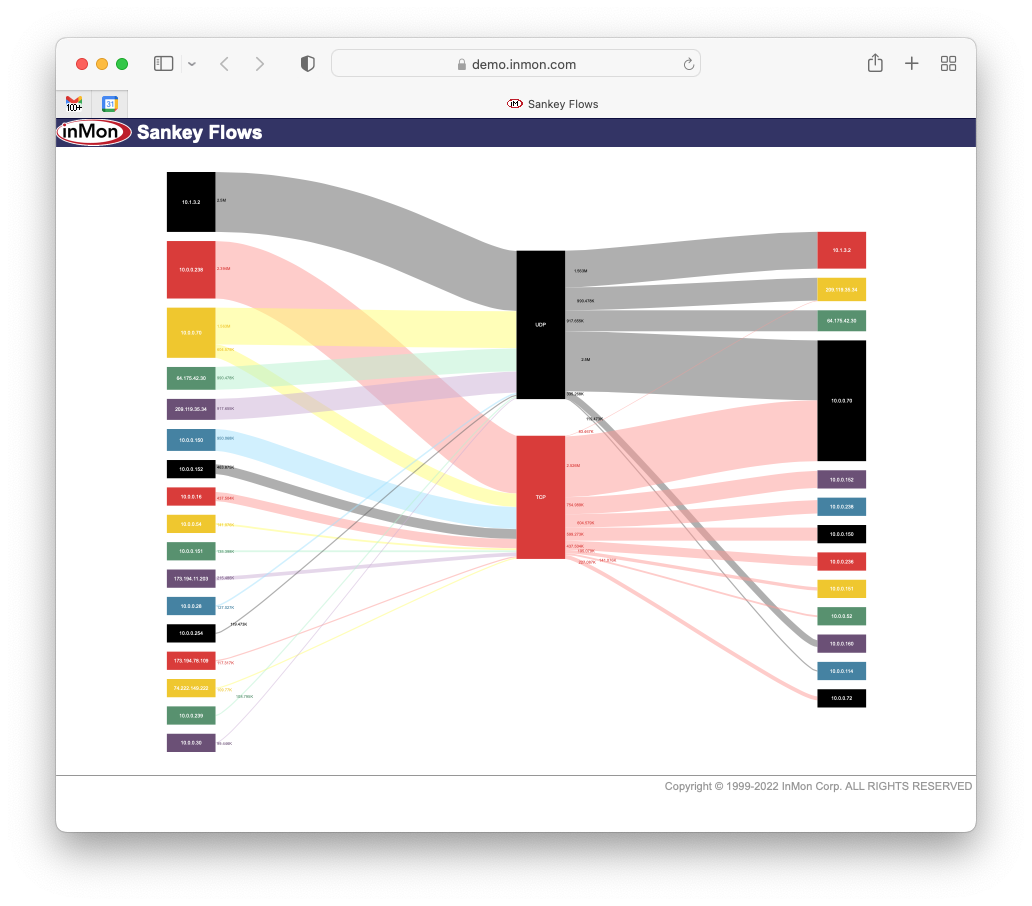
Traffic Sentinel ships with an example "sankey.js" script. Make a Copy and edit to customize. The list of layers defines the columns in the Sankey chart.
// description: sankeyflows
// author: InMon
// date: 5/15/2022
// version: 1.0
// authLevel:operator
// clientJS:sankey-1.0.js
// ttl:60
// view:traffic
// resultFormat: json

// Copy this REST script to create new dashboards
// See http://www.inmon.com/tutorials8/dashboard.php

include('sankey-1.0.js');

new Sankey({
    height: 600,
    layers: ['sourceaddress','protocol','destinationaddress'],
    value: "bps",
    interval: "last5minutes",
    colors: '#000000,#db3a34,#f0c808,#56926e,#6c4f77,#4281a4',
    refresh: true,
    debug: false
}).printResult();
Stand alone dashboards
Stand alone dashboards are a way to share selected information from Traffic Sentinel with a wider audience without requiring a Traffic Sentinel account for each viewer. Access to the dashboard is controlled using the authClients:, authUser: and authPasswd: options in the script header (see REST API Builder tutorial.)
Enabling caching of query results with the ttl: and view: options allows the dashboard to be shared with a large number of viewers without overloading the server since results will only be re-computed when needed, not with every request (see REST API Builder tutorial.)
| Related Topics |
|