
Custom Weather Maps
Starting in version 8.4, the Traffic Sentinel scripting API includes a powerful extension for creating specialized interactive map pages that can reflect dynamic state by varying line-width, colors, shapes and labels. Used as operational dashboards, these are often referred to as "Weather Maps".
Nodes and Edges
In most network maps the nodes represent switches, routers or hosts and the edges represent copper or fiber links, but when defining custom maps we can choose to add nodes representing abstract entities such as a site, building, VLAN, ASN or service and the edges can reprensent relationships of any kind.
Why Script Weather Maps?
Weather Maps have traditionally been hand-crafted using drawing tools: a time-consuming effort that is often out of date within days. By scripting map-generation we can:
- Adapt to network changes
- Use status and traffic queries to populate maps automatically
- Mix manual and automatic layout
- Pass URL parameters in to generate different maps from just one script
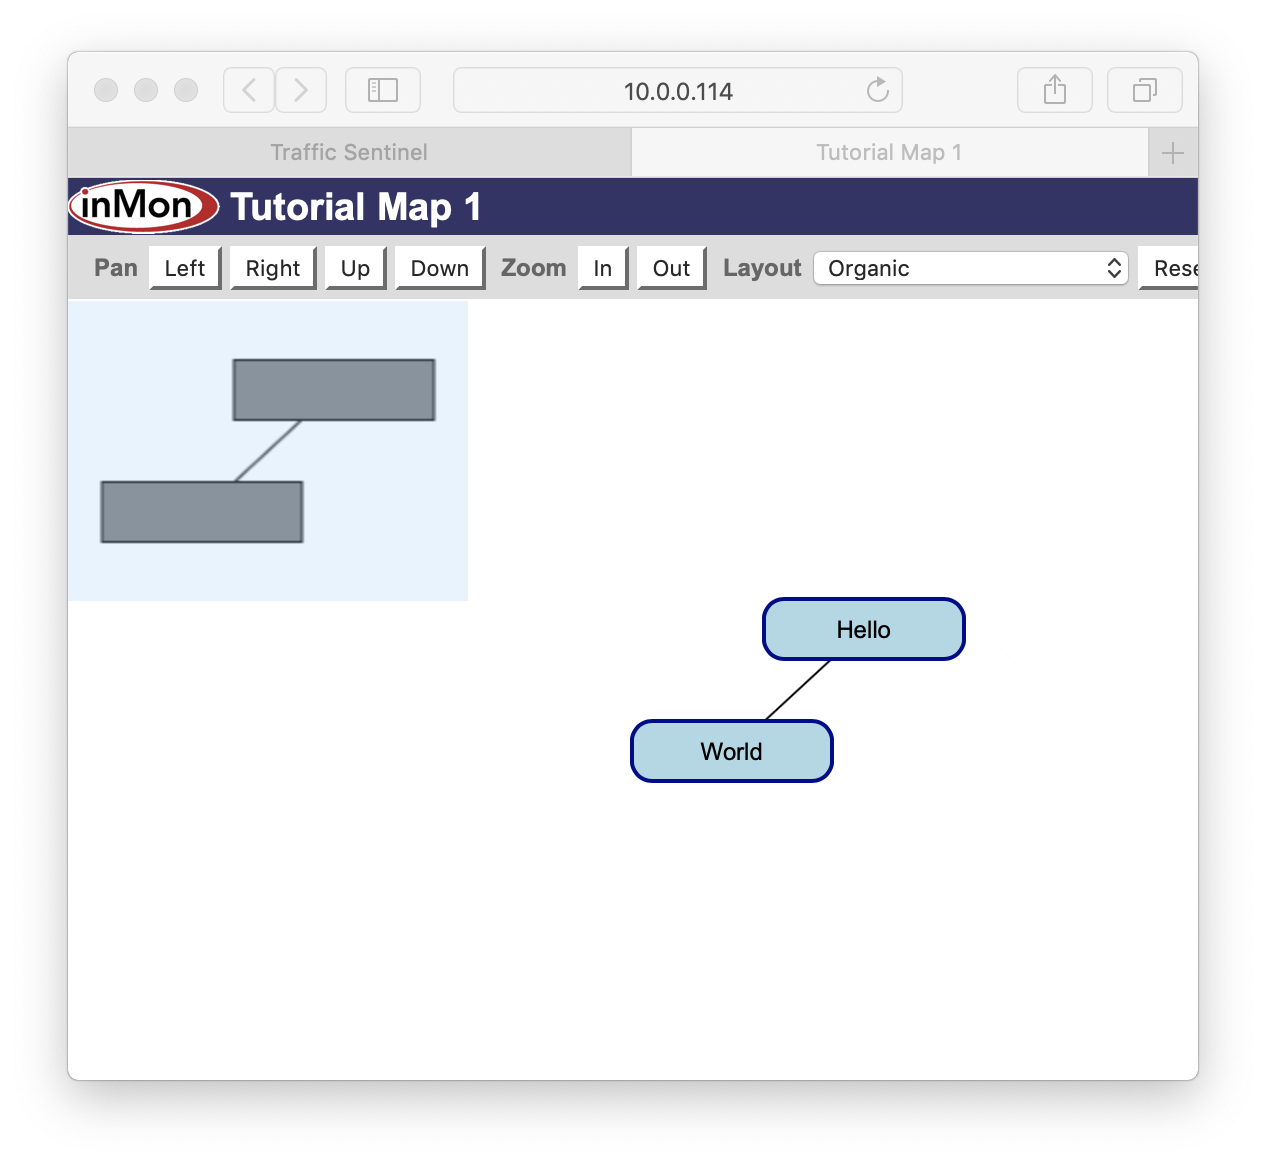
Example 1 - Hello World
The following script, when loaded under File>REST will display the simple map below:
// description: Tutorial Map 1
// author: nhm
// date: 4/25/19
// version: 1.0
// ttl: 60
// clientJS:map-2.0.js
// resultFormat: json

include('map-2.0.js');

var map = new Map();
var node1 = map.addNode("Hello");
var node2 = map.addNode("World");
map.addEdge("link1", node1, node2);
map.printResult();
Notes:
- The structured comment clientJS:map-2.0.js causes the client browser to render the map from the JSON result.
- Use the Test button to inspect the JSON data directly.
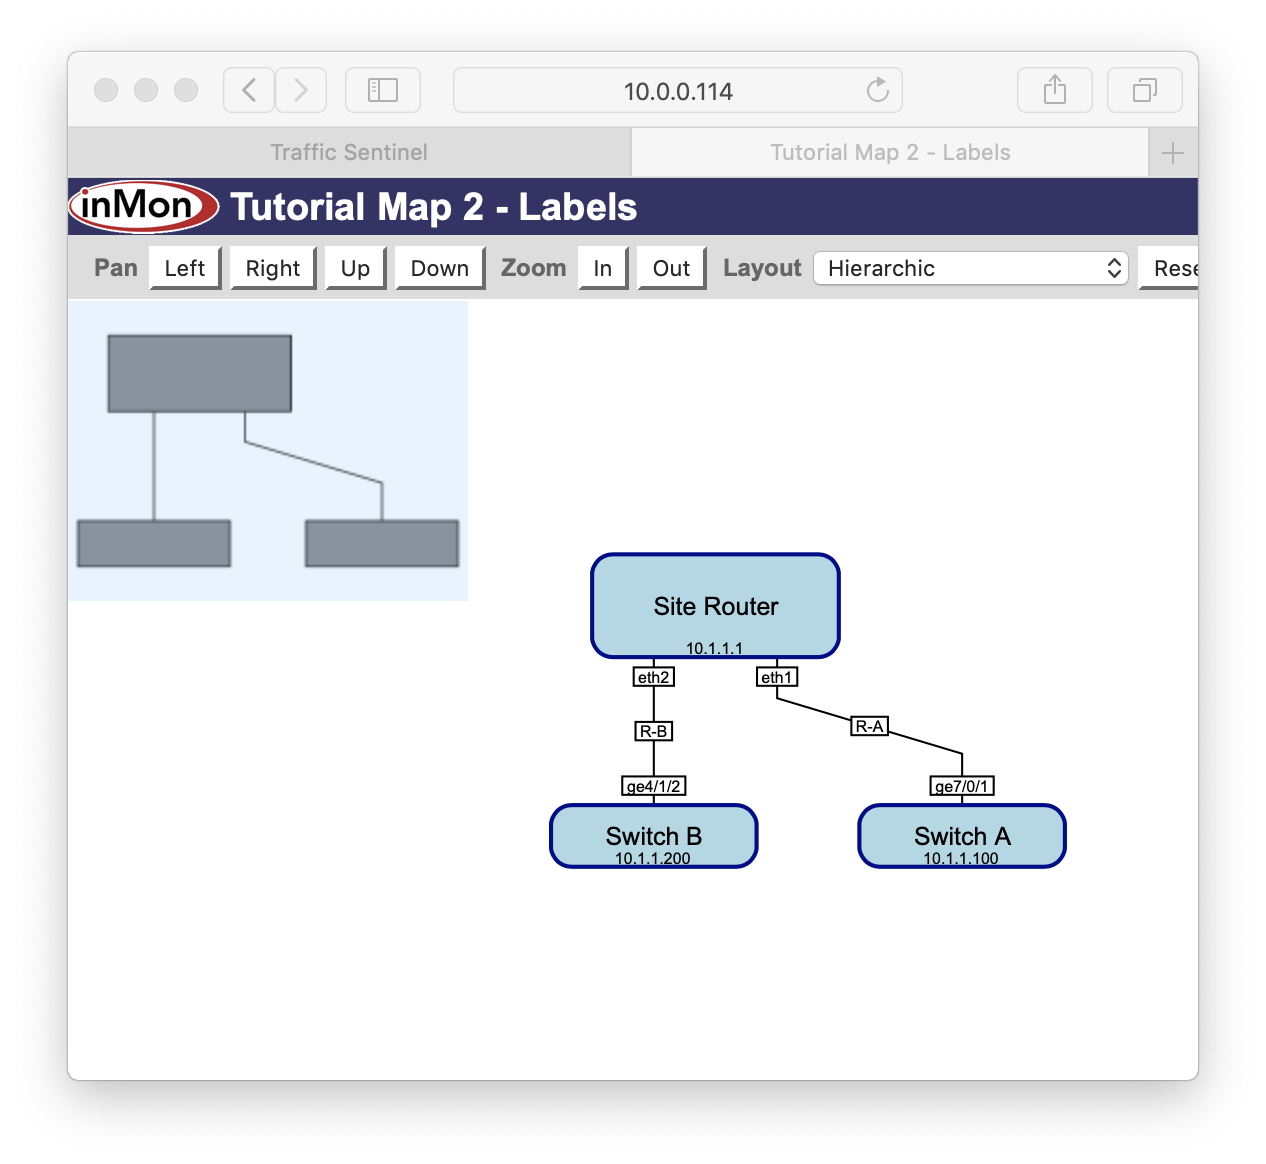
Example 2 - Adding Labels
Extra labels can be added to nodes and links in various positions. The following script, when loaded under File>REST will display the map below:
// description: Tutorial Map 2 - Labels
// author: nhm
// date: 4/25/19
// version: 1.0
// ttl: 60
// clientJS:map-2.0.js
// resultFormat: json

include('map-2.0.js');

var map = new Map({ layout: "hierarchic" });
var node1 = map.addNode("rtr1", { width: 120, height: 50 });
node1.addLabel("Site Router");
node1.addLabel("10.1.1.1");
node1.addLabel("detail to appear on zoom", { position: "N", zoomLevel: 1.2 });
var node2 = map.addNode();
node2.addLabel("Switch A");
node2.addLabel("10.1.1.100");
var node3 = map.addNode();
node3.addLabel("Switch B");
node3.addLabel("10.1.1.200");
map.addEdge("R-A", node1, node2, { name1: "eth1", name2: "ge7/0/1" });
map.addEdge("R-B", node1, node3, { name1: "eth2", name2: "ge4/1/2" });
map.edgeLabelPolicy = Edge.LABEL_BY_ID;
map.printResult();
Notes:
- Node label positions use points of the compass: N,S,E,W,NE,NW,SE,SW and C for center.
- Edge label positions include SC for "Source-Center" and TC for "Target-Center".
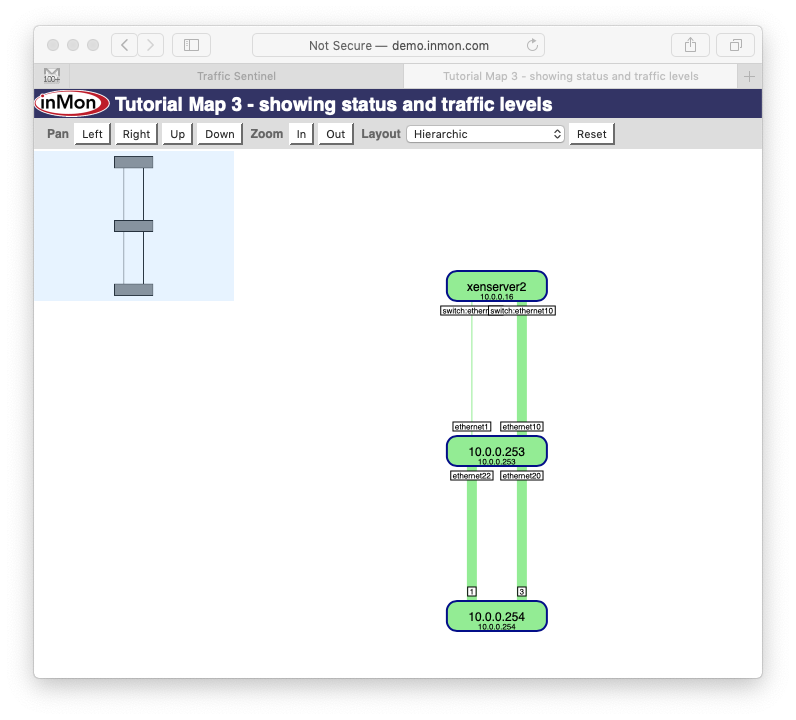
Example 3 - Showing Status and Traffic Levels
Edge width and color can be modulated with traffic queries. The following script will display the map below:
// description: Tutorial Map 3 - showing status and traffic levels
// author: nhm
// date: 4/25/19
// version: 1.0
// ttl: 60
// clientJS:map-2.0.js
// resultFormat: json

include('map-2.0.js');

var map = new Map({ layout: "hierarchic", minNodeDistance: 60 });
map.addAgent("10.0.0.254");
map.addAgent("10.0.0.253");
map.addAgent("10.0.0.16");
map.addLinks();
map.edgeValuePolicy = Edge.VALUE_BY_SPEED;
map.edgeWidthPolicy = Edge.WIDTH_BY_VALUE;
map.edgeColorPolicy = Edge.COLOR_BY_LINK_STATUS;
map.nodeColorPolicy = Node.COLOR_BY_STATUS;
map.printResult();
Notes:
- map.addAgent() is similar to map.addNode() except that it includes extra information.
- map.addLinks() will add known topology links between agents.
- When edges are topology links, convenient policies to set color and weight can be used.
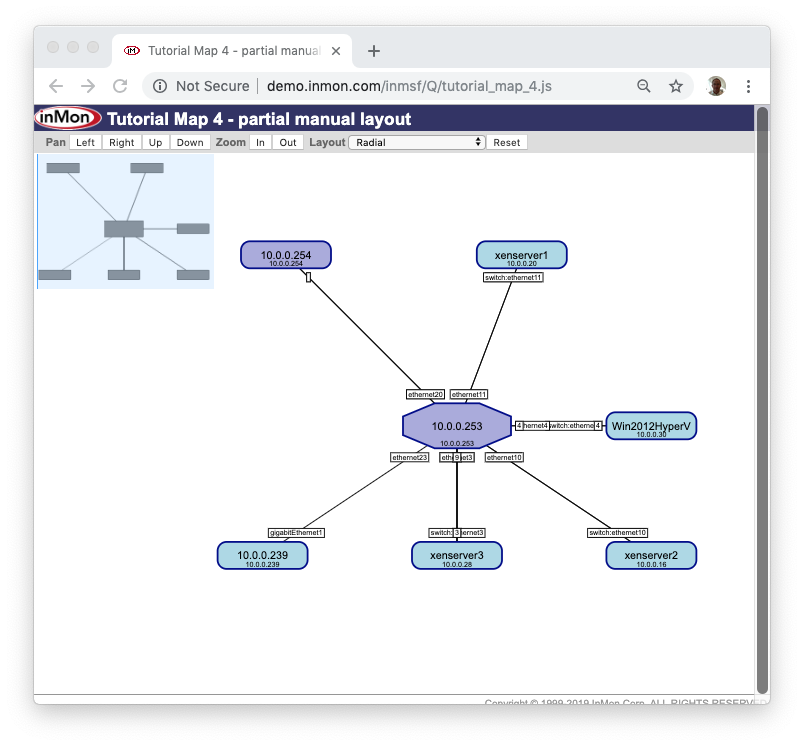
Example 4 - Partial Manual Layout
You can pin the x,y position of some nodes, and allow the rest to be arranged automatically around them. The following script will display the map below:
// description: Tutorial Map 4 - partial manual layout
// author: nhm
// date: 4/25/19
// version: 1.0
// ttl: 60
// clientJS:map-2.0.js
// resultFormat: json

include('map-2.0.js');

var map = new Map({ layout: "radial", minNodeDistance: 75 });
map.addAgent("10.0.0.254", { x: 0.4, y: 0.4, color: "#AAAADD" });
map.addAgent("10.0.0.253",
 { x: 0.5,
   y: 0.5,
   width: 120,
   height: 50,
   shape: "octagon",
   color: "#AAAADD" });
map.addNeighbors();
map.addLinks();
map.printResult();
Notes:
- Nodes 10.0.0.253,10.0.0.254 have been fixed (and given a different color), but the others are arranged automatically.
- The x and y coordinates can be supplied as relative numbers between 0 and 1.
- map.addNeighbors() will add adjacent topology neighbors.
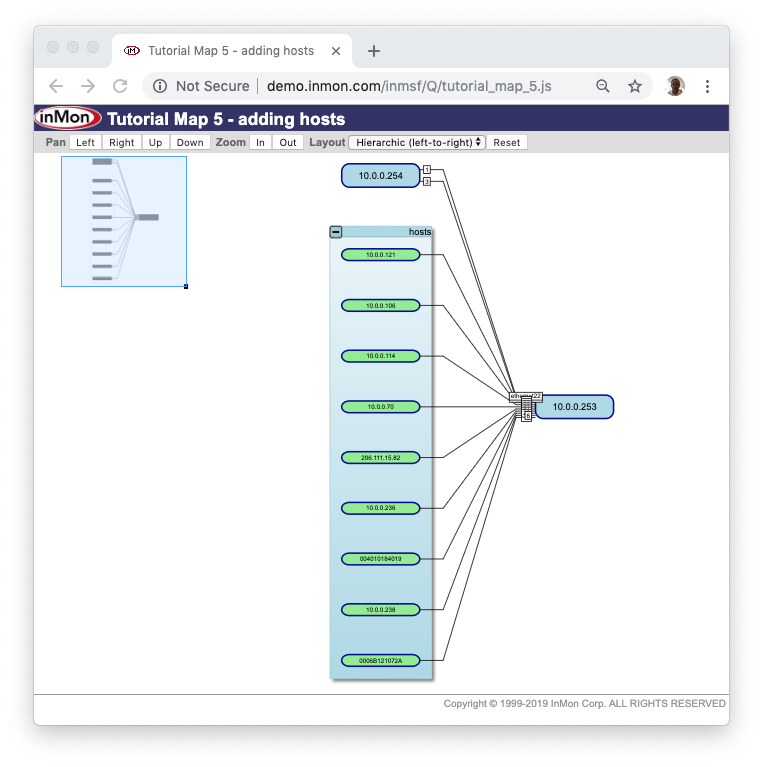
Example 5 - Adding Hosts
You can add nodes for any hosts that are connected to agents in the map. The following script will display the map below:
// description: Tutorial Map 5 - adding hosts
// author: nhm
// date: 4/25/19
// version: 1.0
// ttl: 60
// clientJS:map-2.0.js
// resultFormat: json

include('map-2.0.js');
map = new Map({ layout: "hierarchic left-to-right" });
map.addAgent("10.0.0.253");
map.addAgent("10.0.0.254");
map.addLinks();
map.addLocatedHosts({ color:"light_green",
                      group: "hosts",
                      labelDefaults: { size: 8 } });
map.printResult();
Notes:
- map.addLocatedHosts() will add nodes for the hosts as well as edges for their links.
- Any nodes given a group will be collected into a sub-graph with that name.
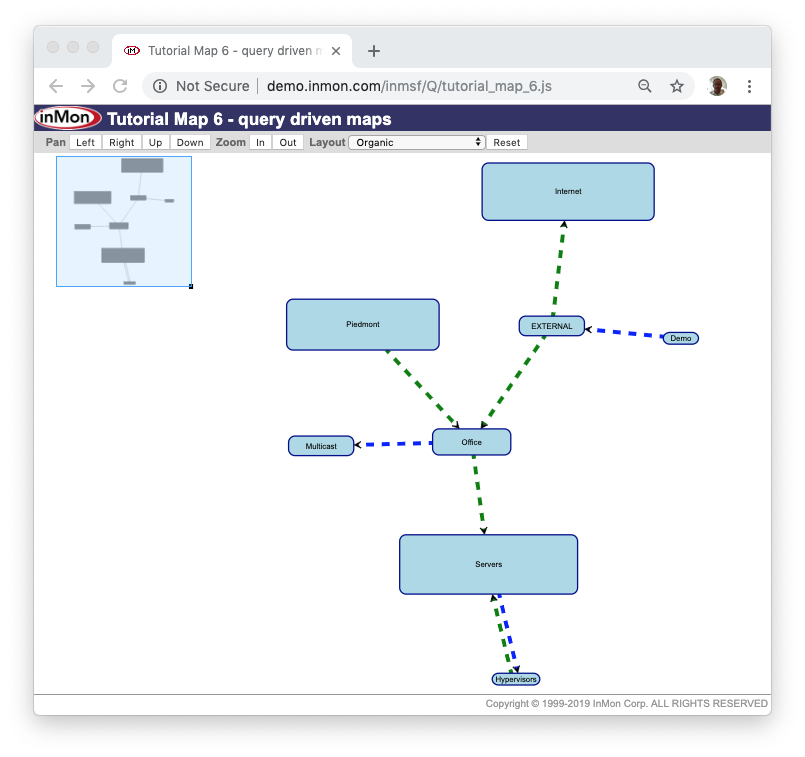
Example 6 - Data Driven Maps
Maps can be created from a query, and then refreshed and redrawn periodically. The following script will display the map below and refresh it every minute with new query results:
// description: Tutorial Map 6 - Data Driven Maps
// author: nhm
// date: 4/25/19
// version: 1.0
// ttl: 60
// clientJS:map-2.0.js
// resultFormat: json

include('map-2.0.js');

map = new Map({ layout: "organic",
                minNodeDistance: 40,
                refresh: true,
                refreshLayout: true,
                directional: true });

var select   = "sourcegroup,destinationgroup,bytes";
var query = Query.topN("traffic", select, "intergroup=1",
                       "last minute", "bytes", 100);
var table = query.run(function(row) {
    var [src,dst,bytes] = row;
    map.addNode(src);
    map.addNode(dst);
    map.addEdge(src+"-"+dst, src, dst,
                { value: bytes, dashed: true, width: 6 });
});
map.edgeColorPolicy = Edge.COLOR_BY_VALUE(function(v) {
    if(v < 1e3) return "gray";
    if(v < 1e6) return "blue";
    if(v < 1e9) return "green";
    return "red";
  });
map.nodeValuePolicy = Node.VALUE_BY_EDGE_VALUE_SUM;
map.nodeSizePolicy = Node.AREA_BY_VALUE;
map.printResult();
Notes:
- Leave page open to see map refresh and re-layout every minute.
- Edges are given value = bytes, which is then used to set their color.
- Nodes are sized by the total traffic they send or receive.
- With map.directional=true, the edges have arrows indicating direction from source to target node.
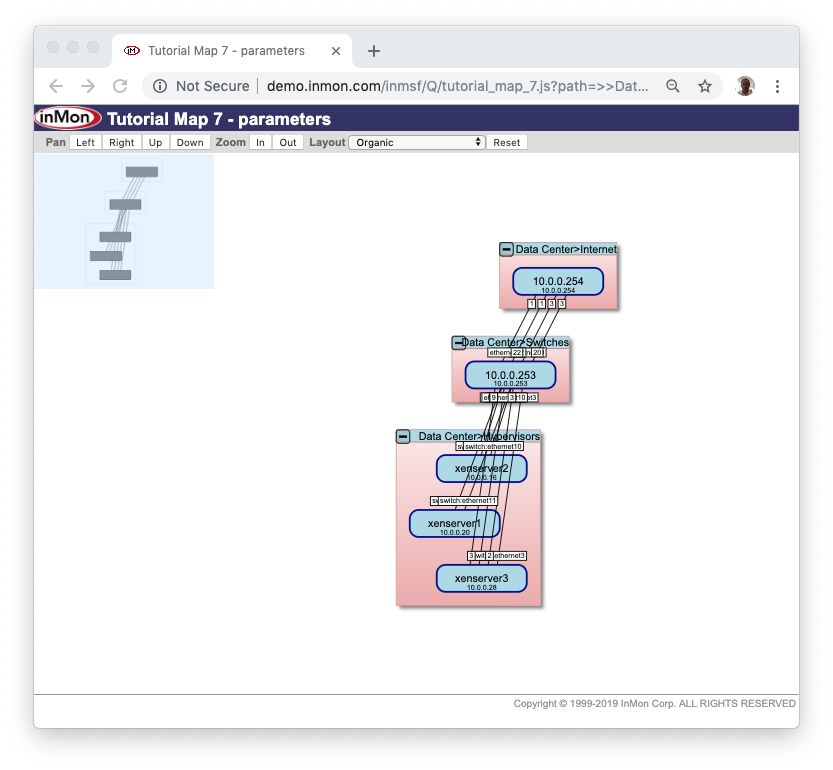
Example 7 - Passing Parameters
By passing URL parameters to the script you can allow one script to generate many different maps. Here we allow a "path" variable to be passed in, which determines which map is drawn. The following script will display all zones and groups by default, but if you add ?path=>>Data Center to the URL then you will get a map showing only the "Data Center" zone, as shown below.
// description: Tutorial Map 7 - parameters
// author: nhm
// date: 4/25/19
// version: 1.0
// ttl: 60
// clientJS:map-2.0.js
// resultFormat: json
// inputs: path

include('map-2.0.js');
var path = path || null;
var net = Network.current();
net.path = path;

map = new Map({ layout: "organic" });
map.setGroupDefaults({ color: "#EEAAAA" });
for each (var ag in net.agents()) {
  net.path = ag;
  var groupId = net.zone() + ">" + net.group();
  map.addAgent(ag, { group: groupId });
}
map.addLinks();
map.printResult();
Label Properties
| Property | Type | Description | Example |
|---|---|---|---|
| text | string | characters to display | |
| size | integer | font size | |
| position | string | label position. Node label positions use points of the compass: N,S,E,W,NE,NW,SE,SW and C for Center, while Edge label positions include SC (Source-Center), C (Center) and TC (Target-Center). | #2 |
| color | string | label color | |
| url | string | URL to link to | |
| zoomLevel | double | suppress label when zoomed out more than this | #2 |
Node Properties
| Property | Type | Description | Example |
|---|---|---|---|
| id | string | Unique identifier and default label | |
| x | number | Location x coordinate (0.0-1.0, or in pixels) | #4 |
| y | number | Location y coordinate (0.0-1.0, or in pixels) | #4 |
| width | integer | Node width in pixels | #4 |
| height | integer | Node height in pixels | #4 |
| label | Label | main label | |
| subLabels | Array<Label> | additional labels | |
| shape | string | rectangle, round_rectangle, octogon or ellipse | #4 |
| color | string | label color | #4 |
| url | string | URL to link to | |
| group | Group | assign node to group | #5 |
| value | number | quantity used with display policies |
Edge Properties
| Property | Type | Description | Example |
|---|---|---|---|
| id | string | Unique identifier | |
| label | Label | main label | |
| name1 | Label | label at source | #2 |
| name2 | Label | label at target | #2 |
| color | string | label color | |
| url | string | URL to link to | |
| value | number | quantity used with display policies | |
| width | number | pixel width of line | #6 |
| dotted | true|false | draw dotted line | |
| dashed | true|false | draw dashed line | #6 |
Group Properties
| Property | Type | Description | Example |
|---|---|---|---|
| id | string | Unique identifier and default label | |
| label | Label | group label | |
| color | string | group color | #7 |
Map Properties
| Property | Type | Description | Example |
|---|---|---|---|
| nodes | Node collection | Nodes keyed by id | |
| edges | Edge collection | Edges keyed by id | |
| groups | Group collection | Groups keyed by name | |
| layout | string | organic,circular,radial,hierarchic,hierarchic-left-to-right,orthogonal | #6 |
| height | integer | Map height in pixels | |
| maxEdgeWidth | integer | Limit on edge width | |
| directional | true|false | Add arrows to edges | #6 |
| minNodeDistance | integer | Push nodes apart | #6 |
| edit | true|false | Allow limited interactive editing | |
| editFile | string | Store interactive changes in data/maps/<fileName> | |
| nodeDefaults | properties | Default node properties | |
| edgeDefaults | properties | Default edge properties | |
| nodeLabelDefaults | properties | Default node label properties | |
| nodeSubLabelDefaults | properties | Default node subLabel properties | |
| edgeLabelDefaults | properties | Default edge label properties | |
| nodeValuePolicy | function(map) | Function to set node values | #6 |
| nodeSizePolicy | function(map) | Function to set node sizes | #6 |
| nodeColorPolicy | function(map) | Function to set node colors | #3 |
| nodeLabelPolicy | function(map) | Function to set node labels | |
| edgeValuePolicy | function(map) | Function to set edge values | #3 |
| edgeWidthPolicy | function(map) | Function to set edge widths | #3 |
| edgeColorPolicy | function(map) | Function to set edge colors | #3,#6 |
| edgeLabelPolicy | function(map) | Function to set edge labels | #3 |
Predefined Policies
| Policy Function | Parameter | Description | Example |
|---|---|---|---|
| Node.LABEL_BY_ID | Set empty node labels to id | ||
| Node.VALUE_BY_EDGE_VALUE_SUM | Set node values | #6 | |
| Node.VALUE_BY_EDGE_VALUE_MAX | Set node values | ||
| Node.AREA_BY_VALUE | Scale node area by value | #6 | |
| Node.COLOR_BY_VALUE | function(value) | Choose node color | |
| Node.COLOR_BY_STATUS | Set status color | #3 | |
| Edge.LABEL_BY_ID | Set empty edge labels to id | #2 | |
| Edge.VALUE_BY_SPEED | Set value from current ifSpeed (for topology link edges) | #3 | |
| Edge.VALUE_BY_BPS | Set value from current bits/sec (for topology link edges) | ||
| Edge.WIDTH_BY_VALUE | Scale edge width by value | #3 | |
| Edge.COLOR_BY_VALUE | function(value) | Choose edge color | #6 |
| Edge.COLOR_BY_LINK_STATUS | Set threeshold status color | #3 |
| Related Topics |
|