Setting thresholds, events and alarms
Traffic Server has a number of components that can be configured to provide automatic notification of network events.
There are a number of components to consider when setting a threshold. Firstly, different thresholds can be set based on media type, media speed and statistic. For example, assigning a value to threshold.utilization.10 will set a utilization threshold for 10Mbit links. Different threshold can be applied to different parts of the network depending on where they are specified in the configuration file.
Every minute Traffic Server computes statistics for each interface it is monitoring. It then applies thresholds that have been specified for each interface. A threshold consists of a threshold value and duration. For example, 60%/4 specifies a threshold value of 60% with a duration of 4 minutes.
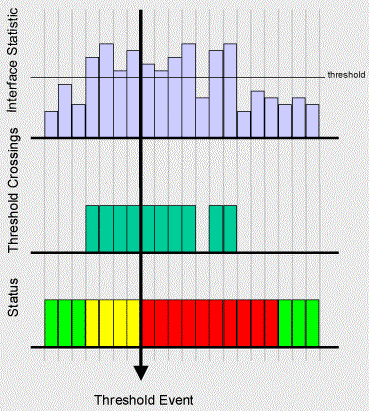
 Figure 1 Applying a threshold
Figure 1 illustrates how the threshold value and duration are applied to generate events and determine the status of each interface. The "Interface Statistics" chart shows the minute by minute changes in an interface statistic. The horizontal line shows the threshold value that has been set. The second, "Threshold Crossings" chart shows the intervals when the threshold value is exceeded. The final "Status Chart" shows the status as marginal ![]() as soon as the threshold value starts to be exceeded. The status changes to critical
as soon as the threshold value starts to be exceeded. The status changes to critical ![]() and an event is generated after 4 consecutive intervals (i.e. 4 minutes) in which the threshold has been exceeded. Finally, it takes 4 intervals of values below the threshold value before the status returns to good
and an event is generated after 4 consecutive intervals (i.e. 4 minutes) in which the threshold has been exceeded. Finally, it takes 4 intervals of values below the threshold value before the status returns to good ![]() .
.
In general, thresholds should be set so that only severe traffic problems that impact quality of service will generate events. Critical events are intended to provide actionable notification of problems to network operators. When setting thresholds try to identify a traffic level that will have a noticeable effect on network service levels. Set a duration that corresponds to an unacceptable period of poor service. The goal is to generate very few, significant events indicating sever problems that require immediate attention.
Suppose that instead of a threshold of 60%/4 we used 60%/9. In this case no event would be generated, since there were only eight consecutive intervals exceeding the threshold. The fact that there are 10 intervals exceeding the threshold within a total period of 11 intervals could be regarded as a significant problem. Often congestion problems occur as in bursts with short quiet periods in between. Generating an event based on a single burst generates spurious events, but setting long event durations results in significant problems being ignored. Traffic Server provides an alternative form for expressing thresholds in order to cope with this situation. Setting the threshold to 60%/10/15 indicates that an event should be generated if any 10 intervals during a period 15 intervals exceed 60%.
Thresholds are not intended as a reporting tool to generate statistical information about network traffic. Traffic Server provides additional mechanisms for generating reports that identify busy links before severe congestion problems occur (see Congestion and SLA Reports).
Interface status information is displayed by selecting Monitor > Traffic from the menu on the left of the Traffic Server web page. The event log can be viewed by selecting Monitor > Events.
Additional actions can be specified for events using the event parameter in the configuration file. Events can be directed to the syslog, sent as email or sent as an SNMP trap (see INMON-TRAP-MIB). When Traffic Server generates events, it includes a URL with each event that can be used to drill-down to the root cause of the event.
| Related Topics |
|
