
Reporting
Traffic Sentinel groups reporting into five functional areas (accessed as tabs under the Reports menu:
- View Lists scheduled reports that are available for viewing. Select a report and view it in a web browser or as a PDF file.
- Run Select a query, specify parameters (such as time, protocol, interface) and run the query. The results can be viewed in a web browser or as a PDF file.
- Edit The report editor is used to assemble queries (or report sections) into reports. Headings, report text and query parameters can be modified in the report editor.
- Schedule Specify a schedule to automatically run reports, how long to keep each report and a list of email addresses to send the report to.
- Script Scripting is described separately in the Scripting Queries tutorial. Most users will not need to use the scripting interface since existing queries available in the Run menu can be customized for most reporting tasks.
This tutorial is divided into two parts: Ad-Hoc Reporting provides an overview of the basic types of query that are available and provides examples demonstrating their use and Scheduled Reporting shows how queries can be combined into reports that are regularly scheduled.
Ad-Hoc Reporting
Traffic Sentinel ships with a large number of pre-built queries that can be modified to answer most questions. Click on the Reports>Run menu to see a list of the major query categories.
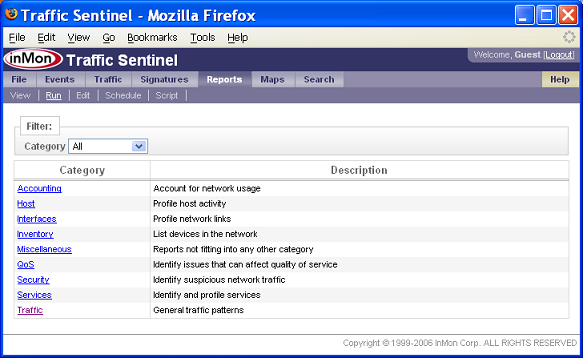
Queries are grouped into reports which are in turn collected together in organizational Categories according to their general application area. For example, the "Security" category contains reports that are aimed at detecting and characterizing security threats and policy violations, while the "Inventory" reports are aimed at listing the various hosts and devices in your network.
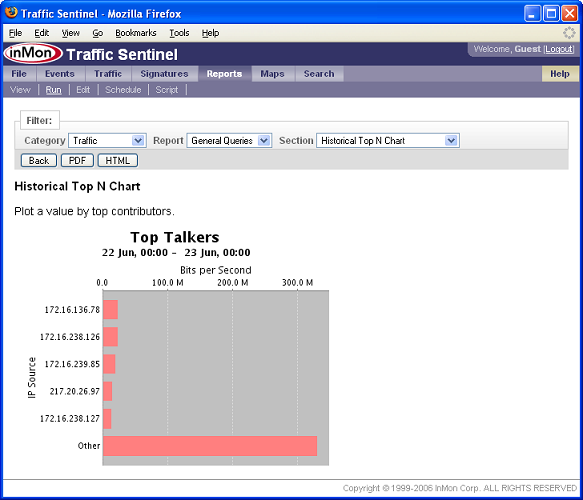
Support we want to run to find the hosts generating the most traffic on the network. This is a "General traffic patterns" query, so click on the Traffic category to see a list of reports:
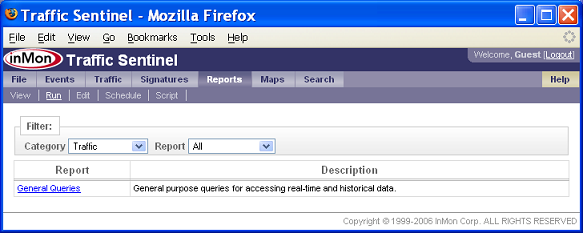
General Queries is the only Report listed; click on it to see the queries that are available.
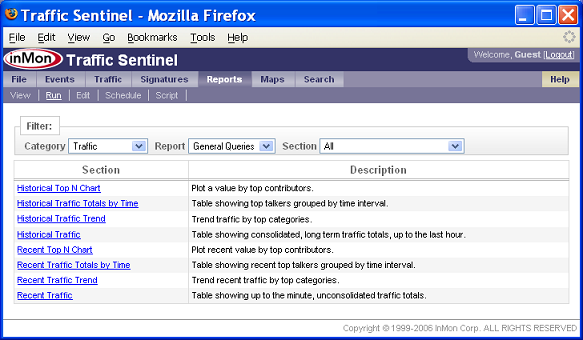
There are a number of queries available. Selecting the right query involves deciding whether we want to look at recent traffic (last 24 hours) or traffic over a longer period (such as the last 30 days). Do we want to trend the data or get totals? Do we want a chart or a table? Suppose we want to see a trend of the top sources of traffic over the last 30 days. Clicking on the Historical Traffic Trend shows the query form:
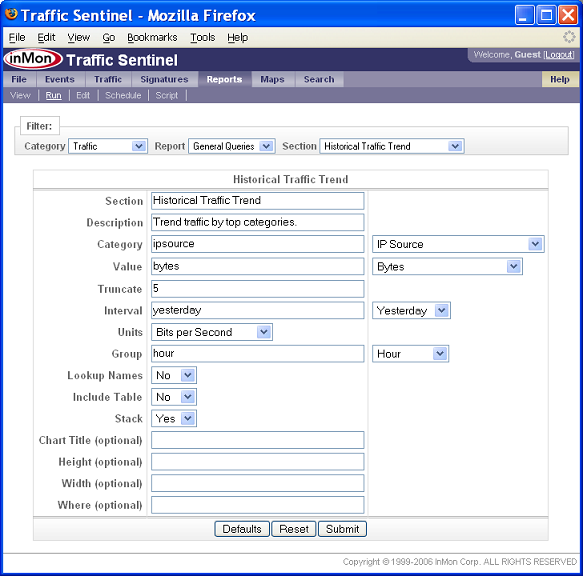
The default setting in the form create a trend of the top 5 IP source addresses plotted by hour for the interval "yesterday". Clicking on the Submit button generates the report. Experiment with different parameter setting to see their effect. Some attributes have a menu to the right of the input field that can be used to input data rather than typing in the input field. Address, protocol and interface menues are populated with items that you have click on or searches for during the session.
Typical settings are provided in the menu for the time Interval, but if you have specific periods you want to report on, then custom intervals can be entered in the input box (see online help);
Many reports contain an optional Where input that can be used to specify boolean filters to further tailor the traffic displayed in the report. For example adding the expression:
iptos != 0in the Where field would show top IP Sources of traffic in which the IP type-of-service bits are set. Filter expressions are further described in the online help.
Clicking on the PDF returns a copy of the report as a PDF, clicking on the HTML button returns an HTML copy. Finally, clicking on the Back button returns to the form, allowing parameters to be changed.
Scheduled Reporting
Reports are constructed by selecting queries, configuring parameters and assembing the queries into a report. Once the report has been constructed, it can be scheduled to run automatically.
Editing a Report
The following steps are the easiest way to create a new report:
- Click on Reports>Edit to access the report editor.
- Click on the New Report button.
- Specify a Category, Report title and Description and click on the Submit to create an empty report.
- Click on the Reports>Run menu and follow the steps described in Ad-Hoc Reporting to specify and run a query. When you looking a the query results, there will be a Copy to Editor button at the top of the query result page to copy the query settings to a new section in the report.
The following screen shot shows the report editor after two sections have been added:
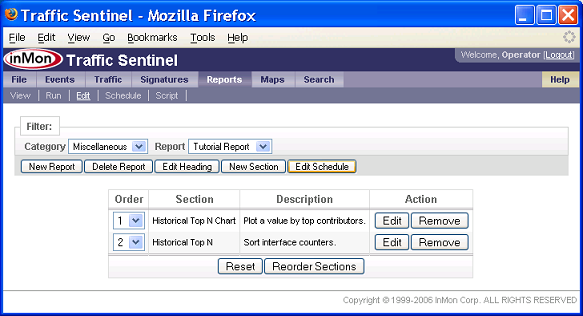
To re-order sections, specify section numbers and then click on the Reorder Sections button. Click on the Editor button next to a section to change its settings. Click on the the Edit Heading button to change report title and description. Once you are happy with the report, click on the Edit Schedule button to schedule the report.
Scheduling a Report
The report schedule form is used to configure a report schedule:
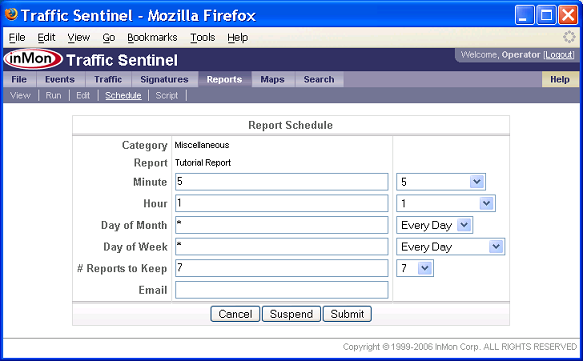
The Minute, Hour, Day of Month and Day of Week fields are used to specify how often to run the report. The menus contain typical options for each field. The #Reports to Keep specifies how many generations of the report to keep before older reports are deleted. The Email field is used to specify a list of email addresses to send the report to. Click on the Submit to schedule the report.
Schedule reports at periods that match their function. For example, an accounting report that summarizes traffic "Yesterday" should be scheduled to run once per day (usually in the early morning - the default reporting time is 1:05 am). If the report summarizes traffic "Last Week", then it should only be run once per week. Security reports are often configured to examine traffic over shorter periods and should be scheduled to run more often. For example a report that looks for port scanning activity over the "Last 5 Minutes" and that is set up to generate alerts should be run every 5 minutes.
The report will be automatically run at the specified intervals. Saved copies of the scheduled reports can be viewed in the Report Viewer.
Viewing a Report
Click on the Report>View menu to view scheduled reports. Pick a Category and a Report to view its contents.
| Related Topics |
|