
Announcing InMon Traffic Sentinel 8.6
June 2021: InMon Traffic Sentinel 8.6 is now available for download. This is a free upgrade for customers who have purchased annual maintenance.
Previous release: 8.5
New features include:
- Network Wide Packet Drop Analysis
- Switch Buffer Depth and Transit Delay
- 'Fabric' Deduplication of Traffic Flows
- Command-line Query Tool
- Performance and Scalability Improvements
Network Wide Packet Drop Analysis
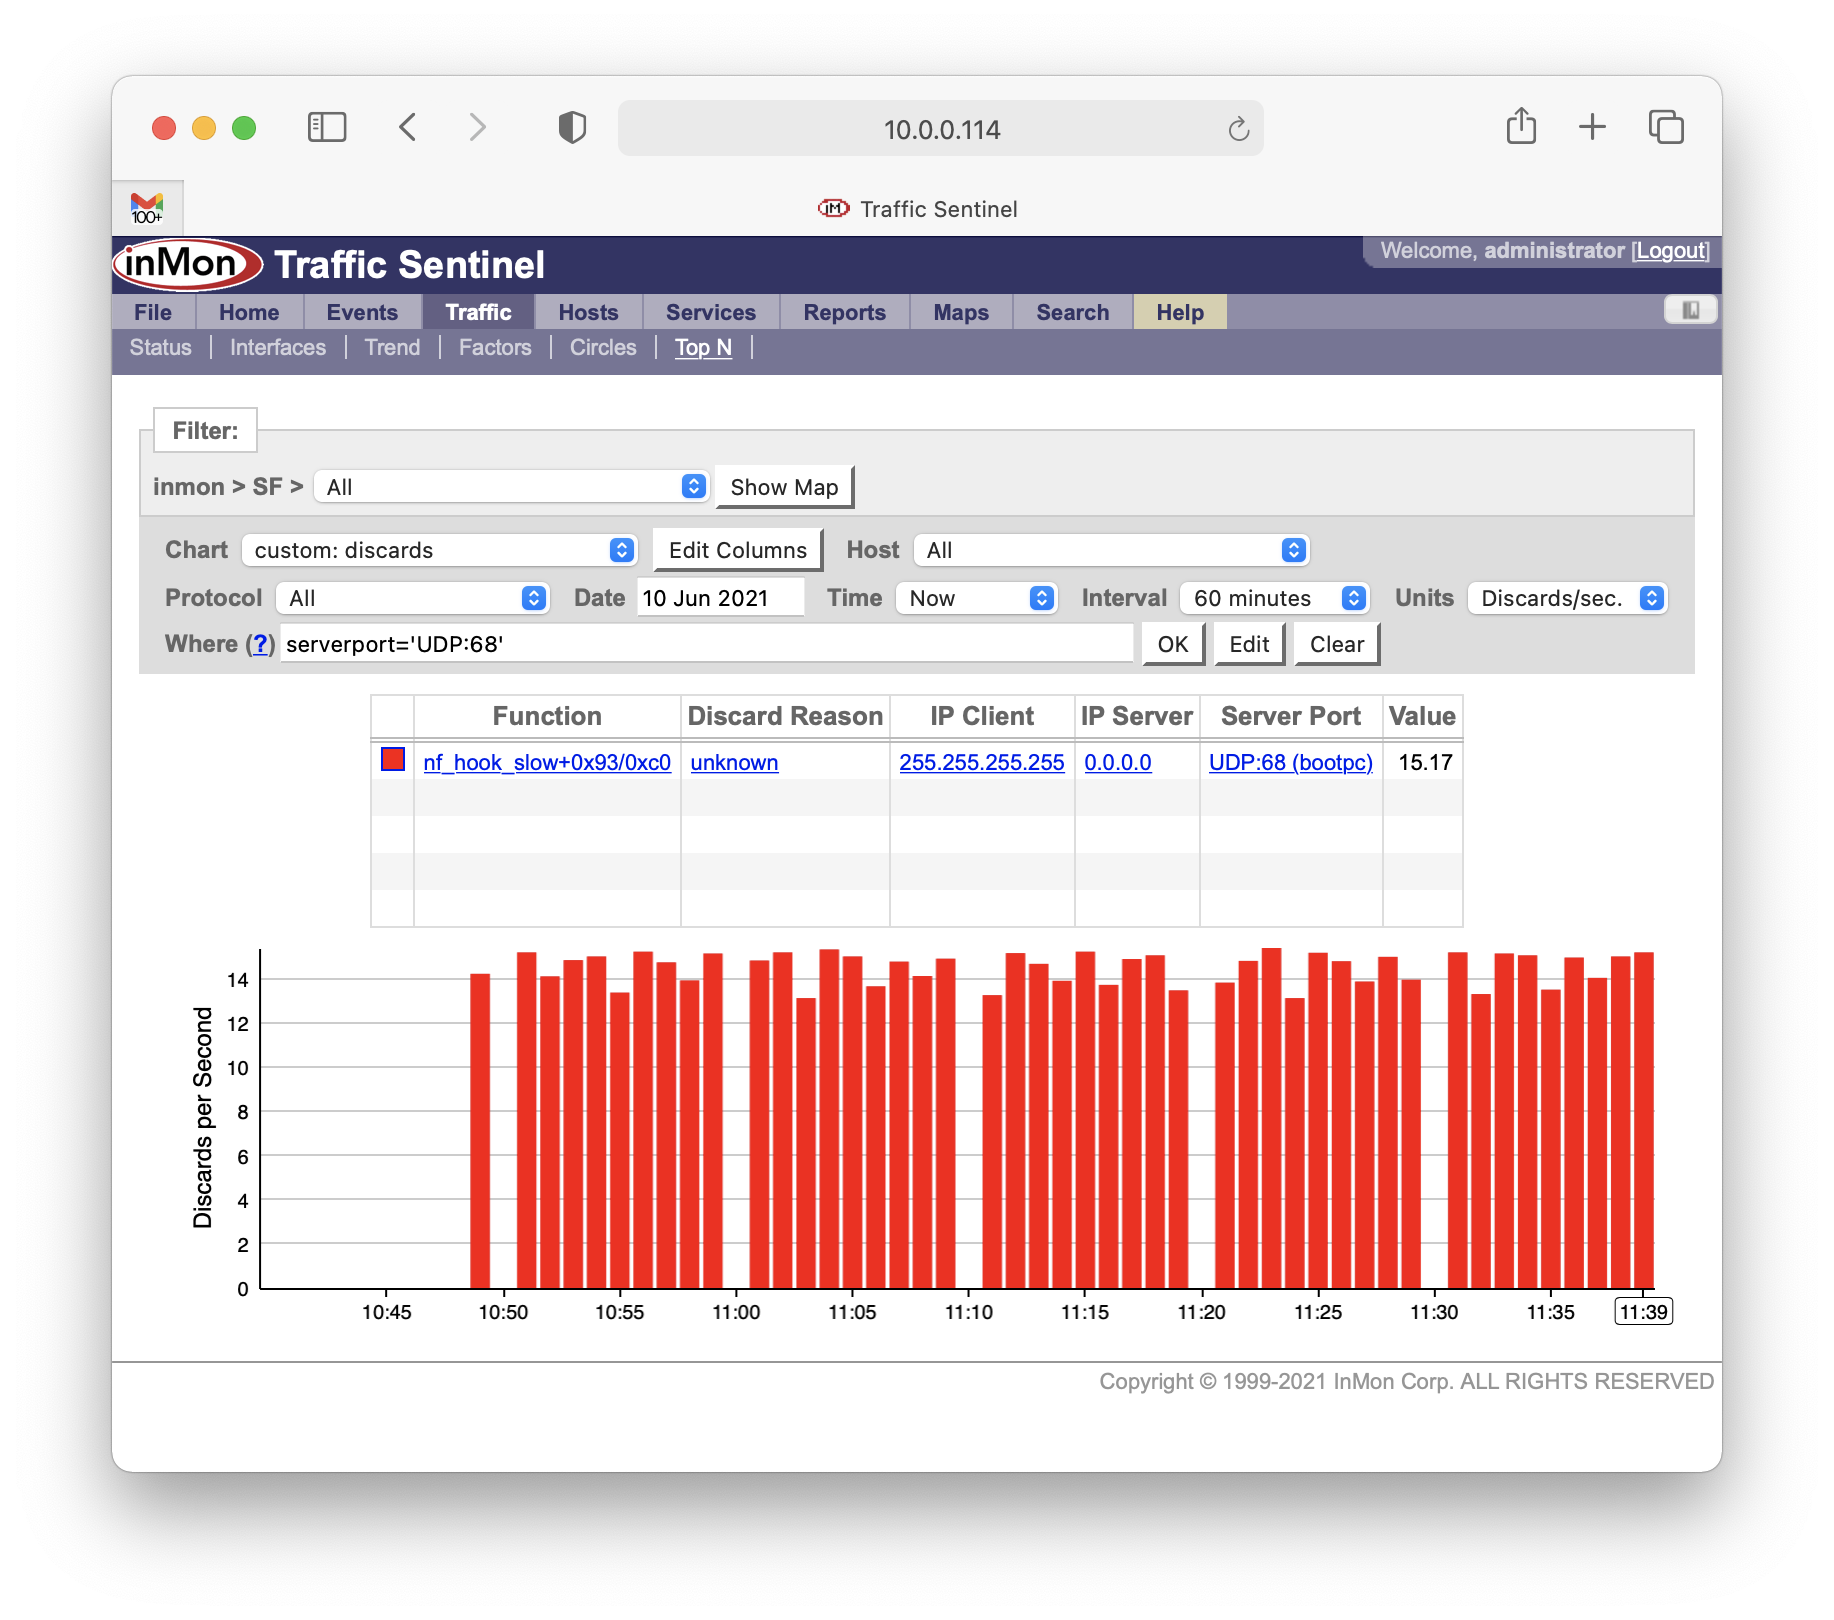
The sFlow standard now includes a mechanism to report the headers of dropped packets, along with the reason the packet was dropped. This extension is already supported in host-sflow and some hardware switches. This represents a transformative new way to investigate packet discards across the whole network and work backwards to find the root cause. In Traffic Sentinel you can browse this data simply by selecting "discards/sec" as the Units on the Traffic>TopN page. When the discard is in software the Linux kernel will identify the kernel function where it happened. This feed is rate-limited, not sampled. So even a single dropped packet will be reported.
Switch Buffer Depth and Transit Delay
When a switch ASIC samples a packet the sFlow standard now allows it to capture the buffer-depth seen by that packet and the transit delay for that packet through the switch. By attaching those measurements to the random-sampled packets the measurement overhead for the switch is still low, but repeating patterns will emerge to show what traffic is seeing (or causing) buffering delays.
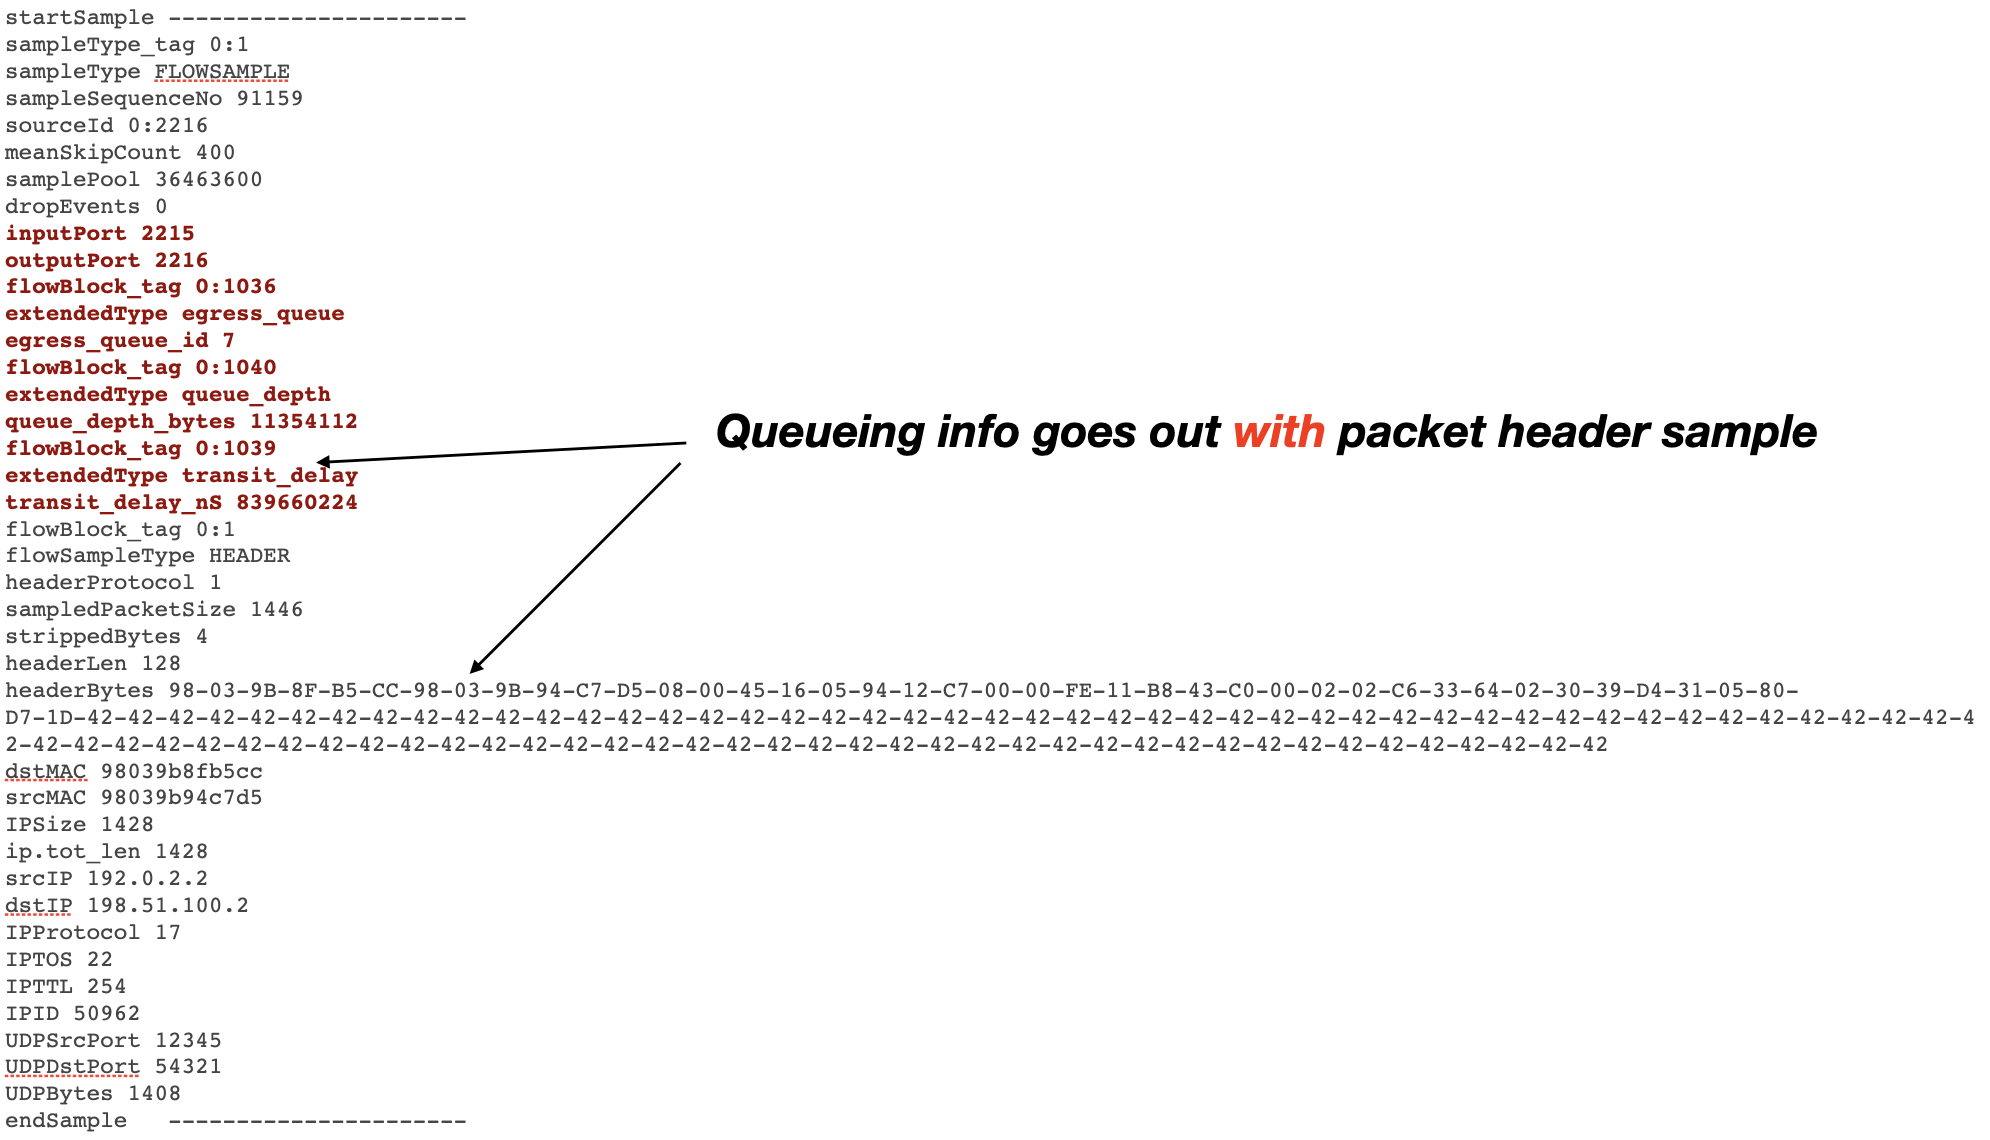
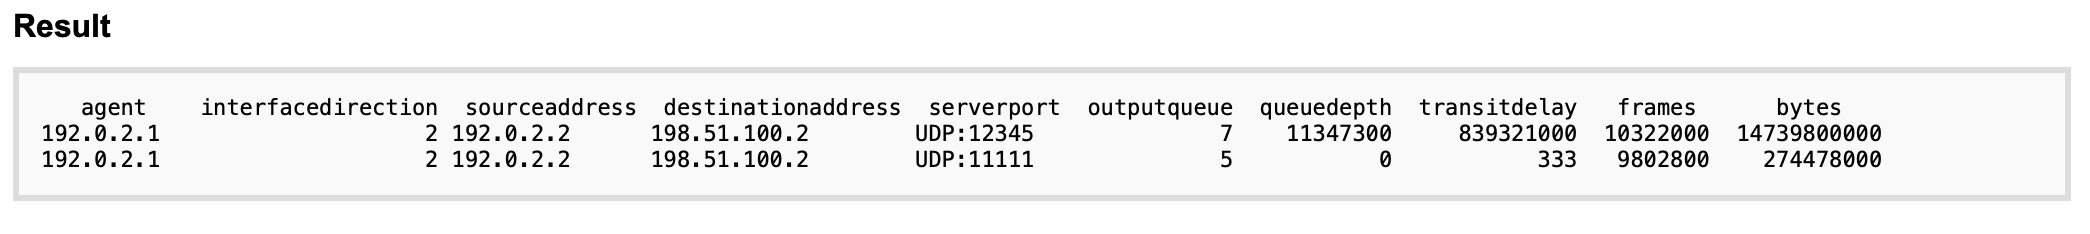
The new fields in the Traffic Sentinel traffic database are "outputqueue", "queuedepth" and "transitdelay".
'Fabric' Deduplication of Traffic Flows
The default deduplication mode in Traffic Sentinel is an algorithm that makes very few assumptions about the network topology and monitoring agents, but if your layer-2 topology is accurately resolved and you have traffic monitoring enabled everywhere (e.g. sFlow and LLDP are running on all switches) then setting QueryPlacementMode=fabric in global.prefs will cause traffic queries to adopt a much faster algorithm.
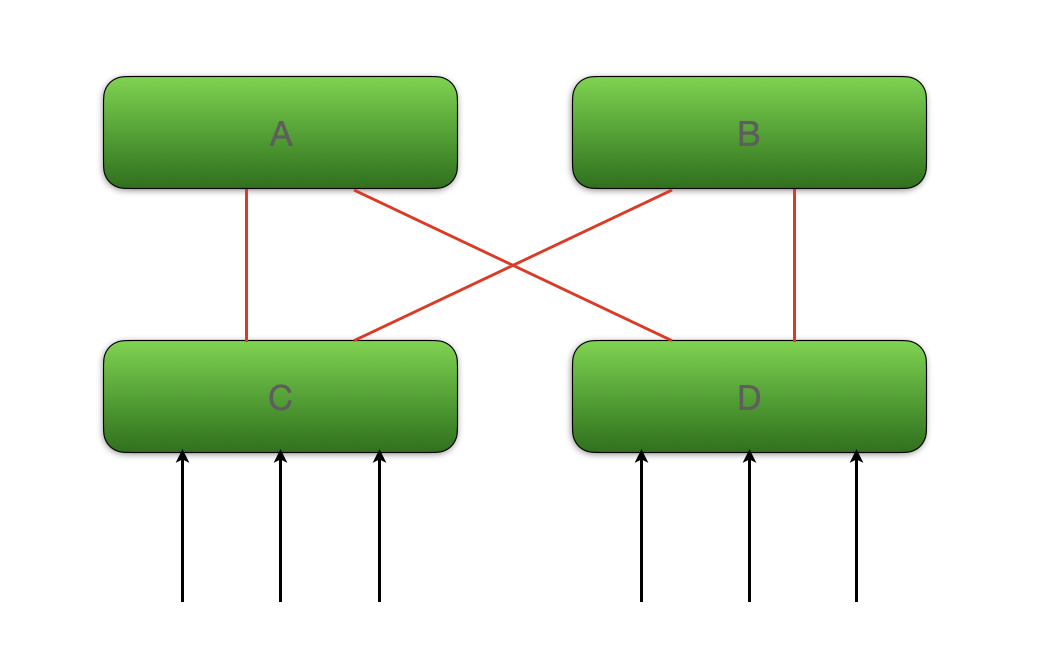
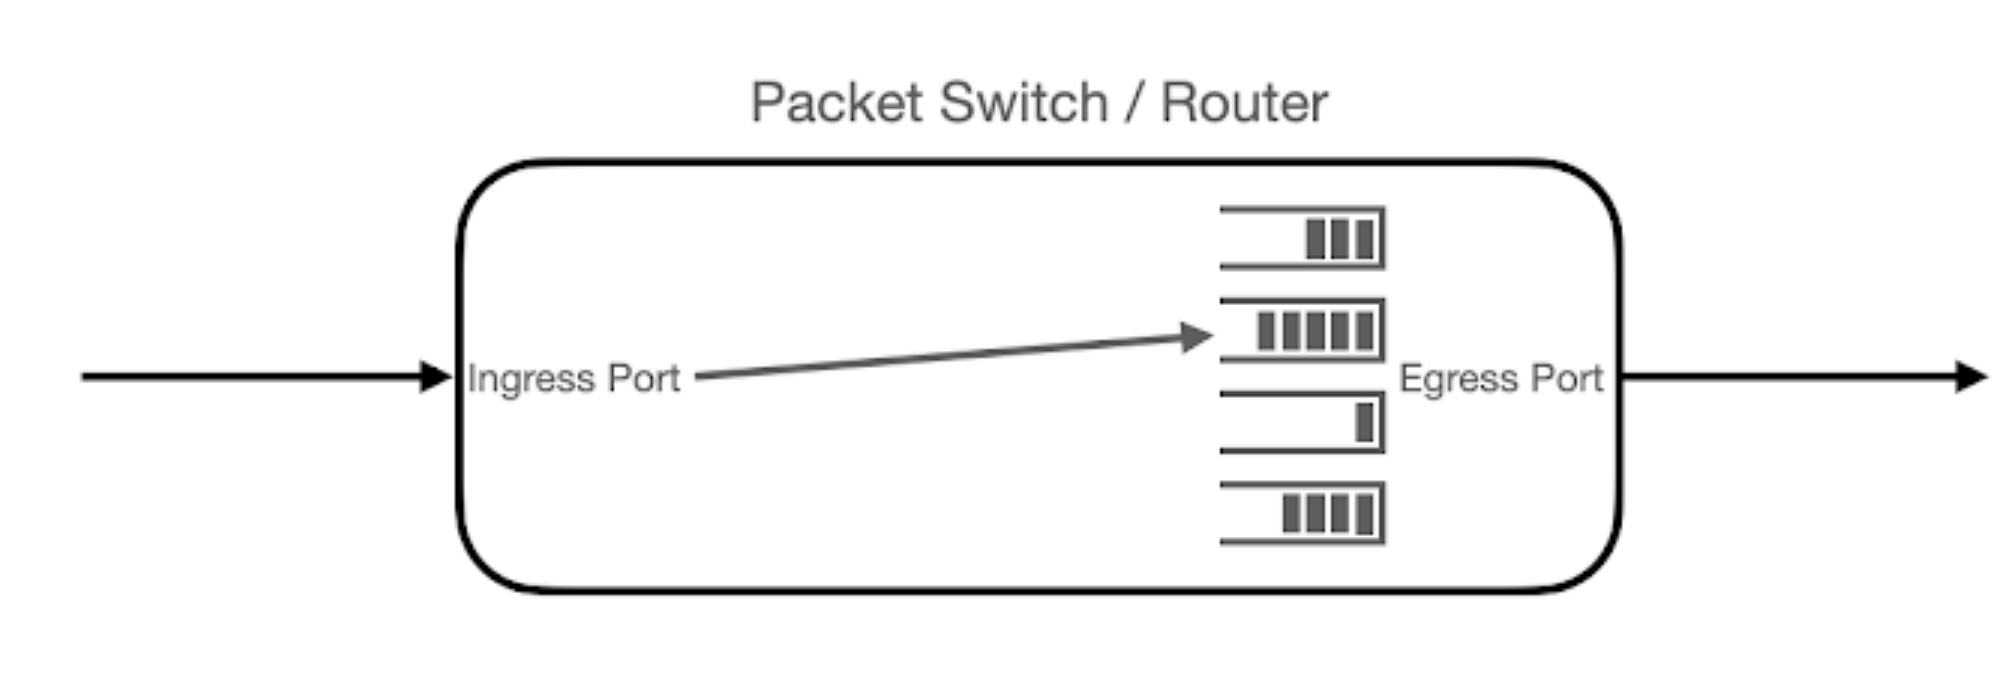
The "fabric" dedup sums traffic entering the fabric. Observations made on internal ports (the red links in the diagram above) are not included. If a filter scopes the query to just one part of the network then that becomes the "fabric" for that query. If you think this might help accelerate some or all of your analytics then please contact support for assistance.
Command-line Query Tool
In Sentinel 8.6 the traffic, counters, events and discards queries can all be accessed directly from the Linux command line. This CLI program understands how to parse the select, filtering and time-interval expressions just as they are used with the Query class in the Javascript API, so the invocation can be terse and intuitve. The query parameters can be set on the command line or passed in as a JSON structure. The results output can be CSV or JSON.
% /usr/local/inmsf/inx/bin/query -?
usage: Query.lua [OPTIONS]

OPTIONS:
  -v <view>      : query view (traffic|ifcounters|host|...)
  -s <select>    : select expression
  -w <where>     : filter expression
  -r <sort>      : sort term
  -a             : sort ascending
  -n <truncate>  : topN only
  -G             : global truncate (topN across all groups)
  -o             : suppress 'other' value
  -u             : allow null keys
  -U             : allow null values
  -i <interval>  : e.g. 'last5minutes'
  -g <group>     : group minutes|'minute'|'hour'|'day'
  -z <tz>        : IANA timezone name
  -H <hours>     : e.g. '8-11,13-17'
  -D <days>      : e.g. '2-7' (1=Sun,7=Sat)
  -V <var=value> : e.g. $mask='10.100.0.0/16/24,0.0.0.0/0=OTHER'
  -j <JSONArray> : JSON query-array
  -J <path>      : JSON query-array from file ('-J-' to read from stdin)
  -T <threads>   : set number of worker threads
  -m <dedupMode> : override dedup mode (e.g. -m 'off')
  -p <prefix>    : override result row prefix
  -f <format>    : e.g. (txt|json)

DIAGNOSTICS:
  -?             : print usage
  -d             : increase debug level
  -c             : no query cache
  -t             : test - compile only
  -R <path>      : dump raw file data
  -S <path>      : dump raw file symbol info
This new feature makes it easier than ever to use Traffic Sentinel in a "headless" mode, extracting data directly into your own tools and scripts without going through the web UI. For example, to query the top 5 talkers of https traffic over the last 5 minutes the command is:
/usr/local/inmsf/inx/bin/query -s sourceaddress,bytes \
-w serverport=TCP:443 -i last5minutes -r bytes -n 5 -f json
Performance and Scalability Improvements
For Sentinel 8.6 the query engine was overhauled and streamlined, taking advantage of 128-bit integer support in modern compilers and microprocessors. This improved performance and lowered the memory footprint for most queries. To further boost performance, see the tutorial on Sentinel Performance Tuning.