
Announcing InMon Traffic Sentinel 6.0
InMon Traffic Sentinel 6.0 is now available for download. This is a free upgrade for customers who have purchased annual maintenance.
Previous release: 5.0
New features include:
- Improved Traffic>TopN and Traffic>Circles charts
- Interactive filtering in Traffic>TopN and Traffic>Circles charts
- Fully customisable Traffic>TopN charts
- Easily accessible and sortable interface counters trend charts
- Monitor converged Ethernet storage (iSCSI, FCoIP, FCoE and AoE)
- Monitor Java virtual machine performance
- Monitor HTTP performance
- Monitor Memcache performance
- Monitor TRILL
- Monitor spanning tree
Improved Traffic>TopN and Traffic>Circles charts
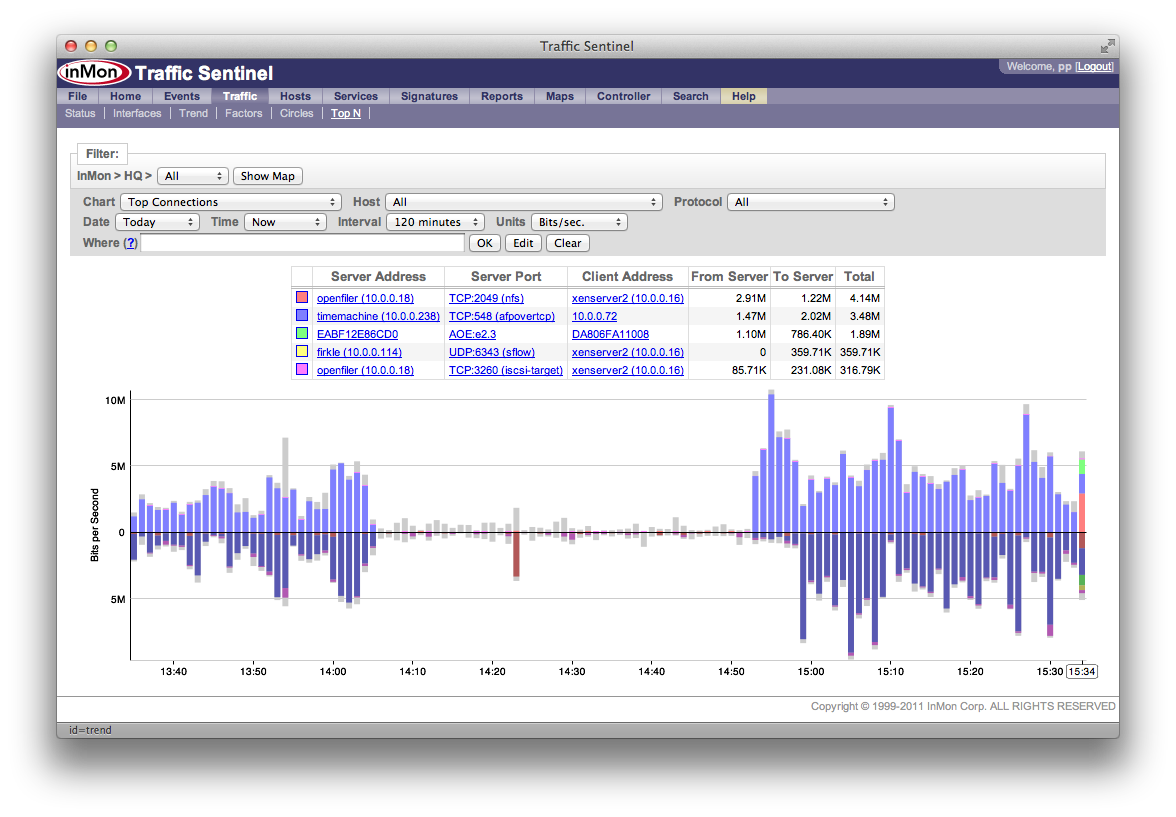
New HTML5 interface for real-time monitoring means that charts appear more quickly and can be displayed on HTML5 compatible browsers without requiring Java applet support. Removing the requirement for Java allows charts to be displayed on mobile platforms (e.g. smart phones, tablets etc.)
Note: Java applets are still required to display network maps.
Interactive filtering Traffic>TopN and Traffic>Circles charts
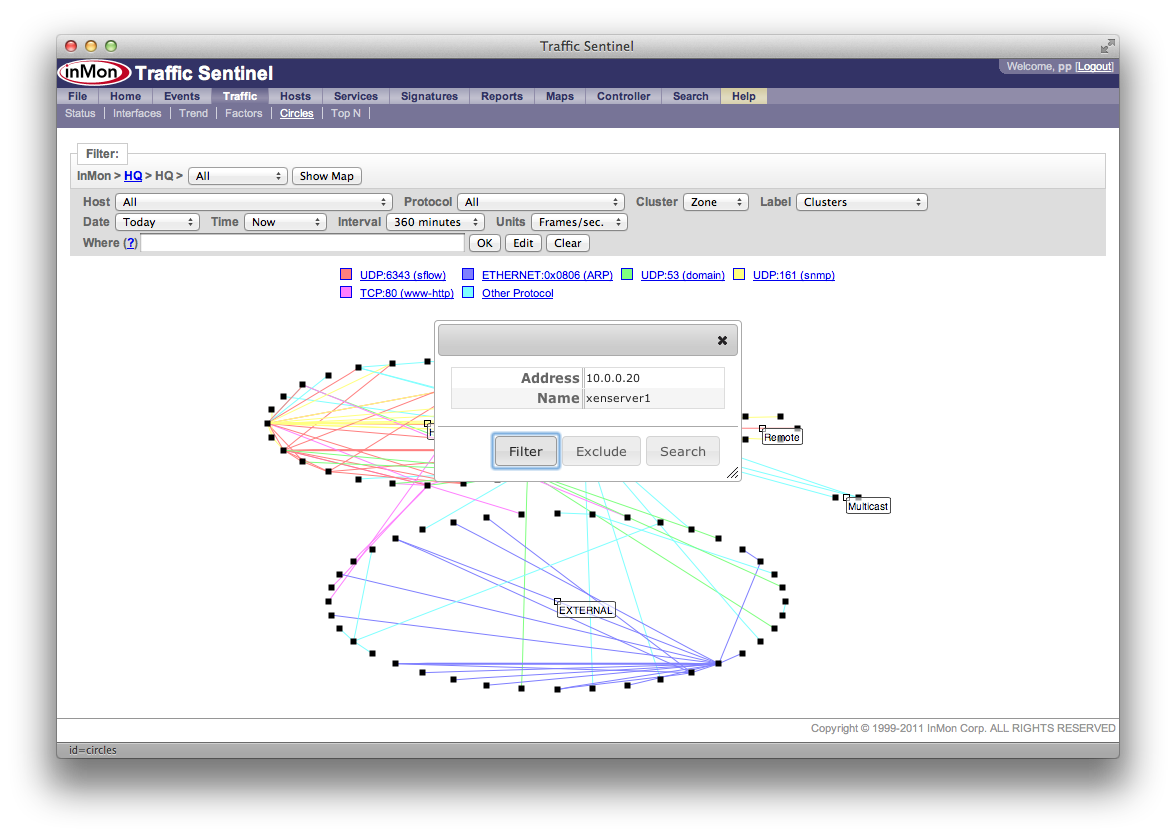
Clicking on items in the Top N and Circles charts pops up a dialog with Filter and Exclude buttons, simplifying the creating of Where filters.
Fully customisable Traffic>TopN charts
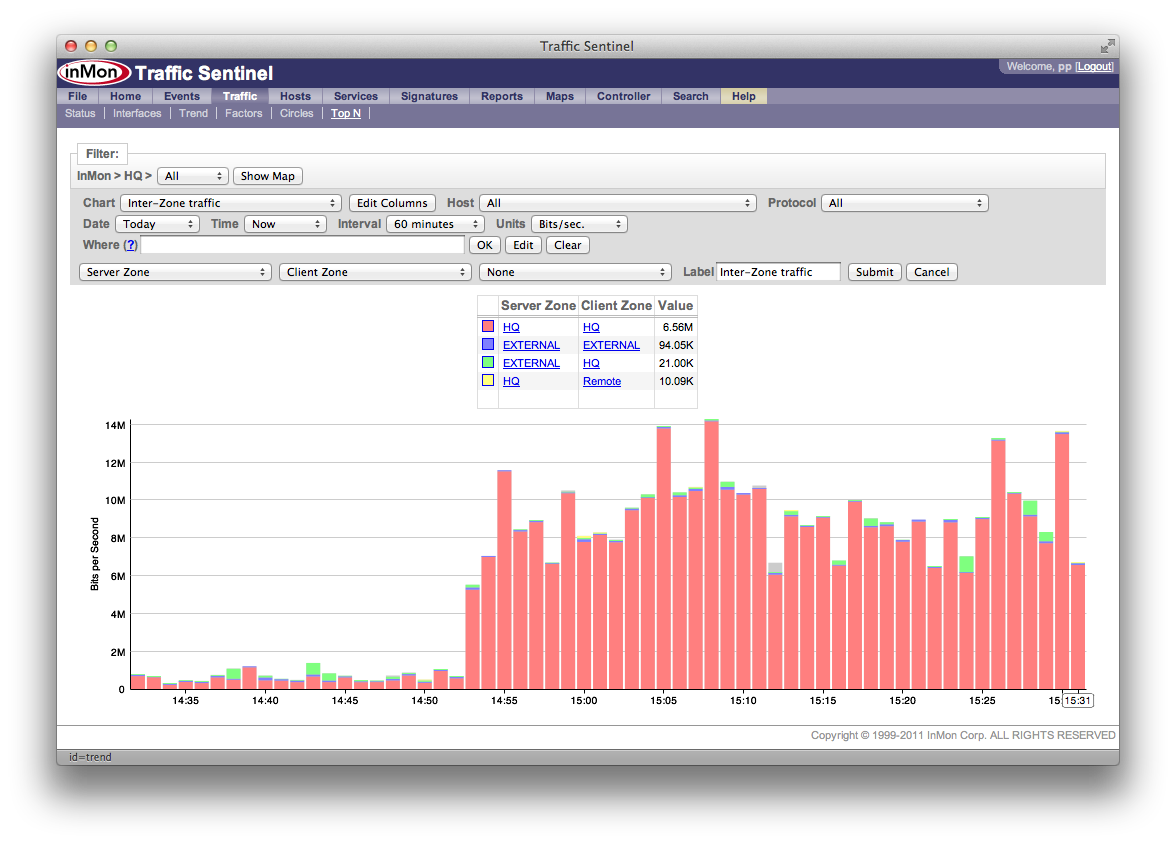
Each users can create up to 16 custom Top N charts. Each custom chart can contain multiple flow keys and be assigned a user defined name.
Easily accessible and sortable interface counters trend charts
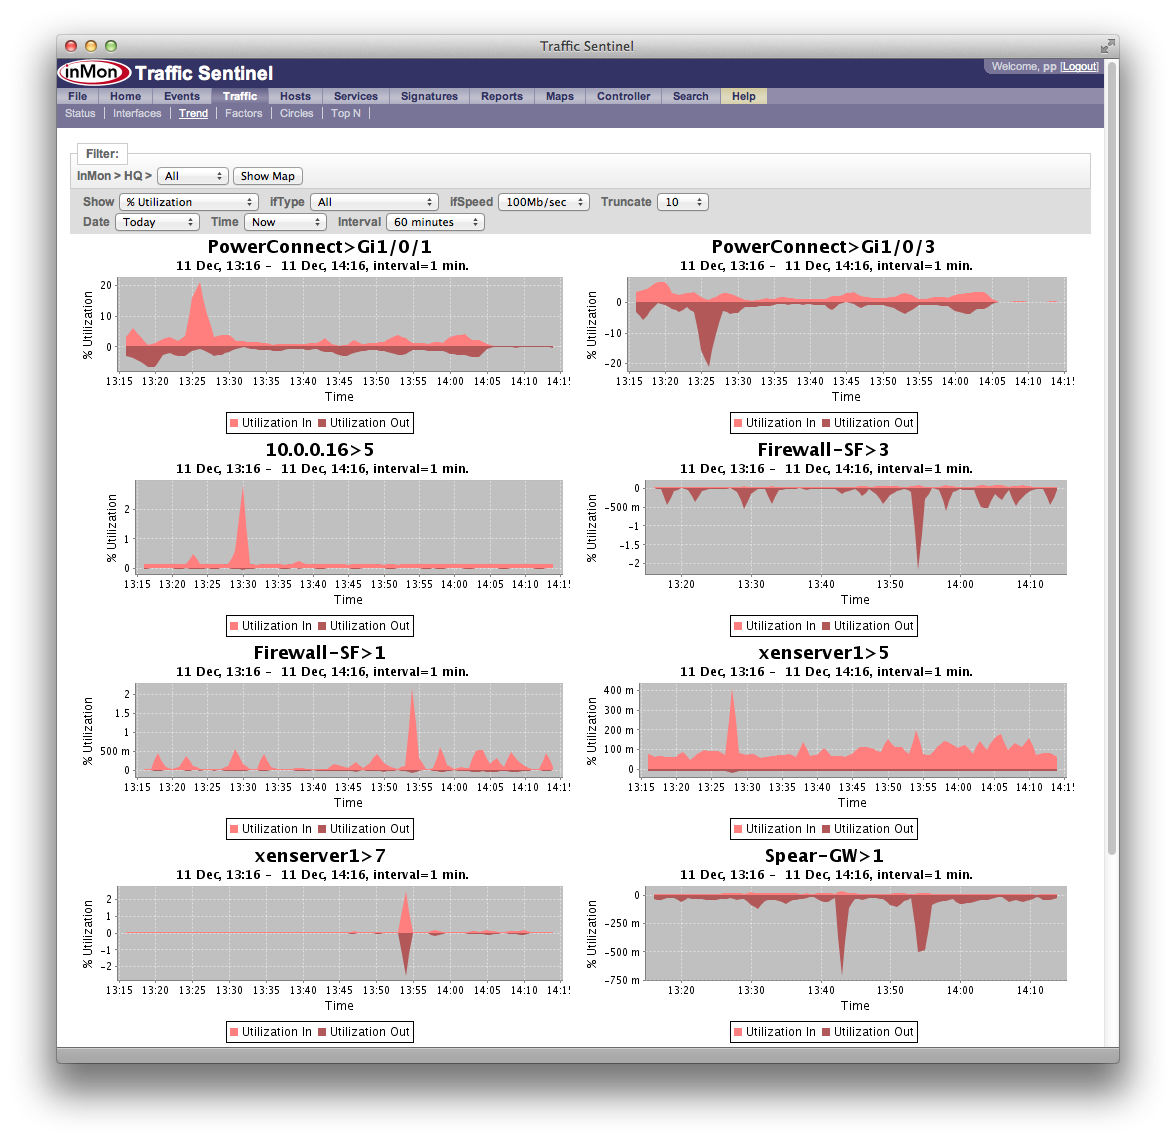
A sorted table of interface trend charts allows multiple interfaces to be trended simultaneously. The interfaces can be filtered by network location, ifType and ifSpeed.
Monitor converged Ethernet storage (iSCSI, FCoIP, FCoE and AoE)
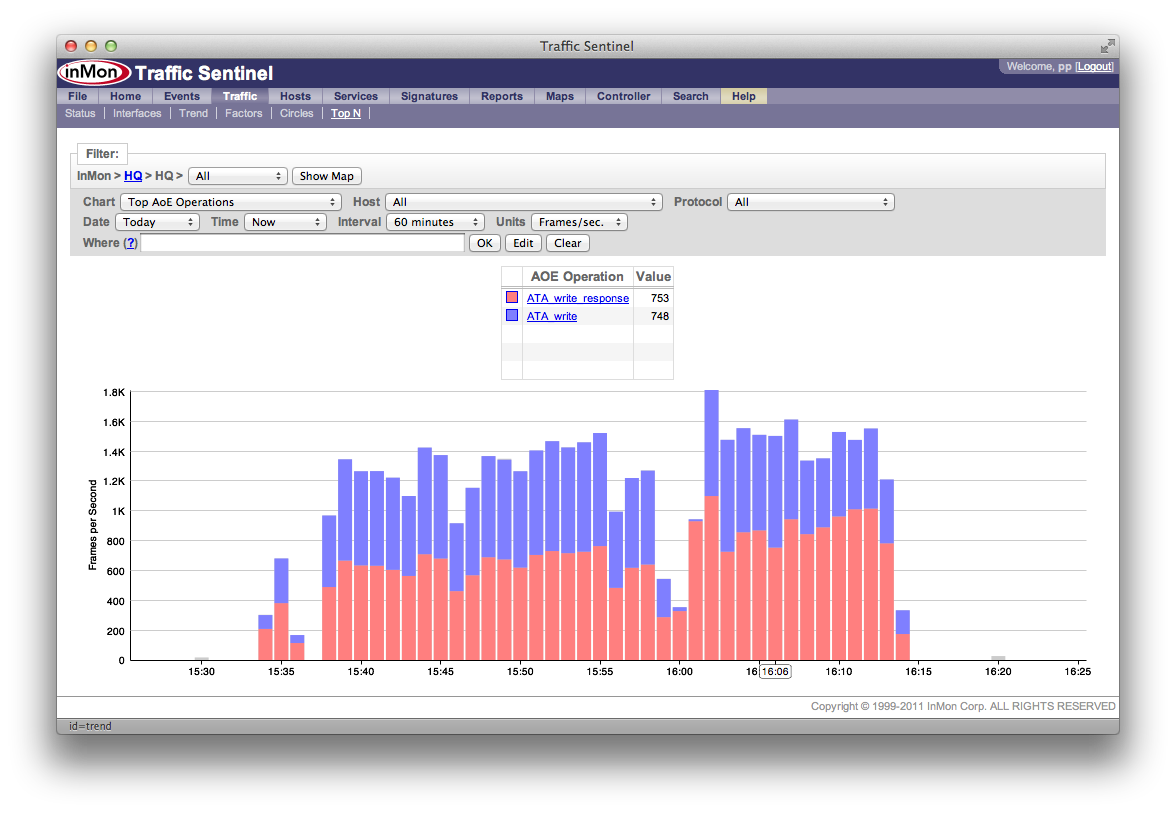
Deep decoding of network storage protocols allows Traffic Sentinel to display additional details, including storage operation (e.g. read/write) for iSCSI, FCoIP, FCoE and AoE traffic monitored using sFlow from switches.
Monitor Java virtual machine performance
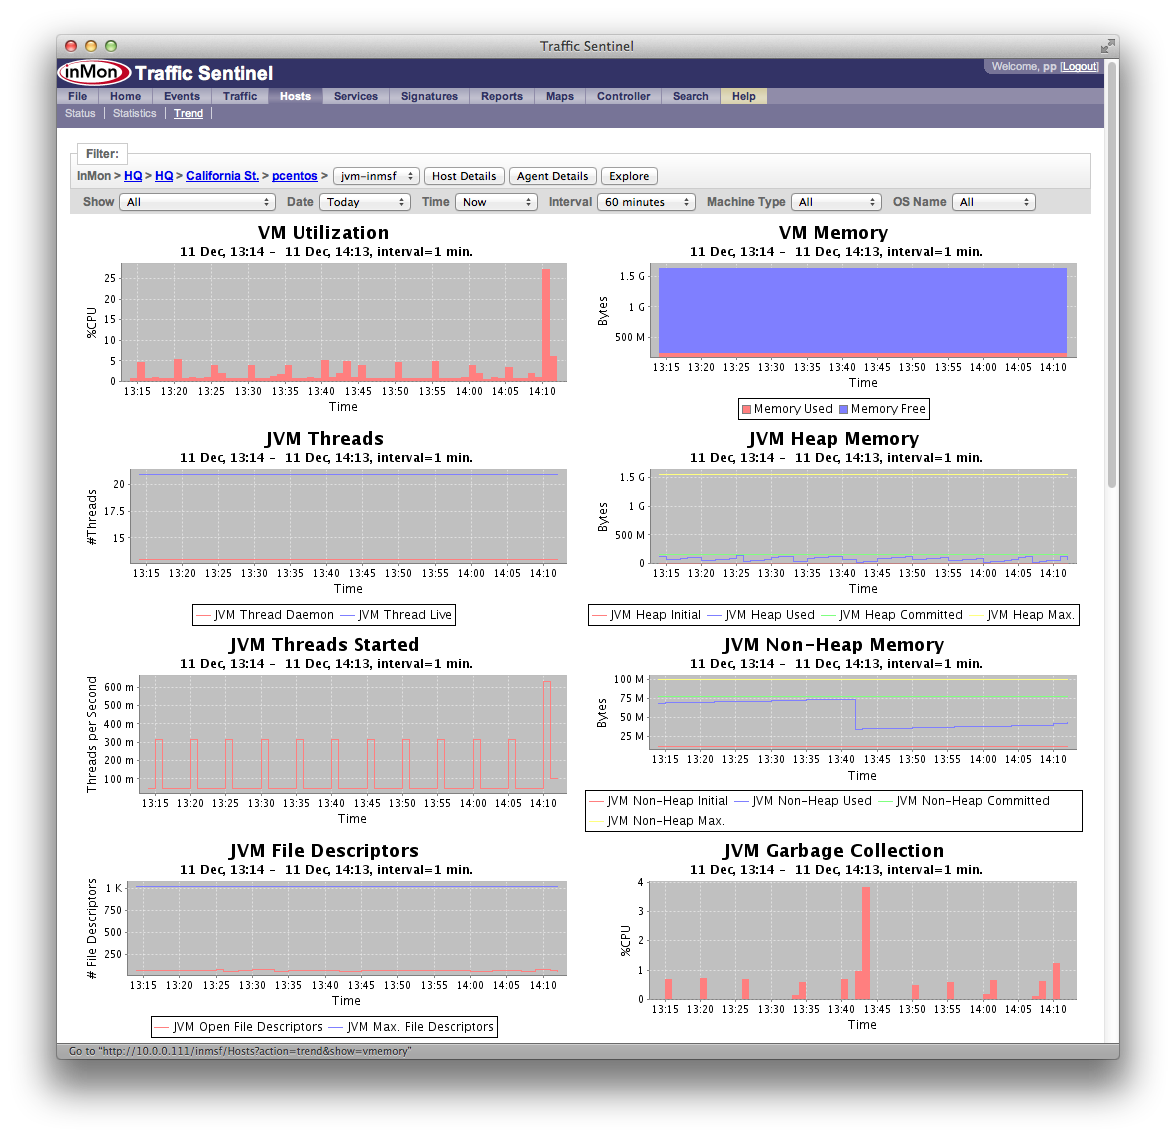
A new extension to the sFlow standard allows Java virtual machines to contribute their key performance metrics (garbage collection, heap and non-heap memory, threads...). The jmx-sflow-agent is a free, open source, implementation of the standard. Support for the new Java metrics is integrated with Traffic Sentinel's existing server and virtual machine performance monitoring tools added in Traffic Sentinel 5.0.
Monitor HTTP performance
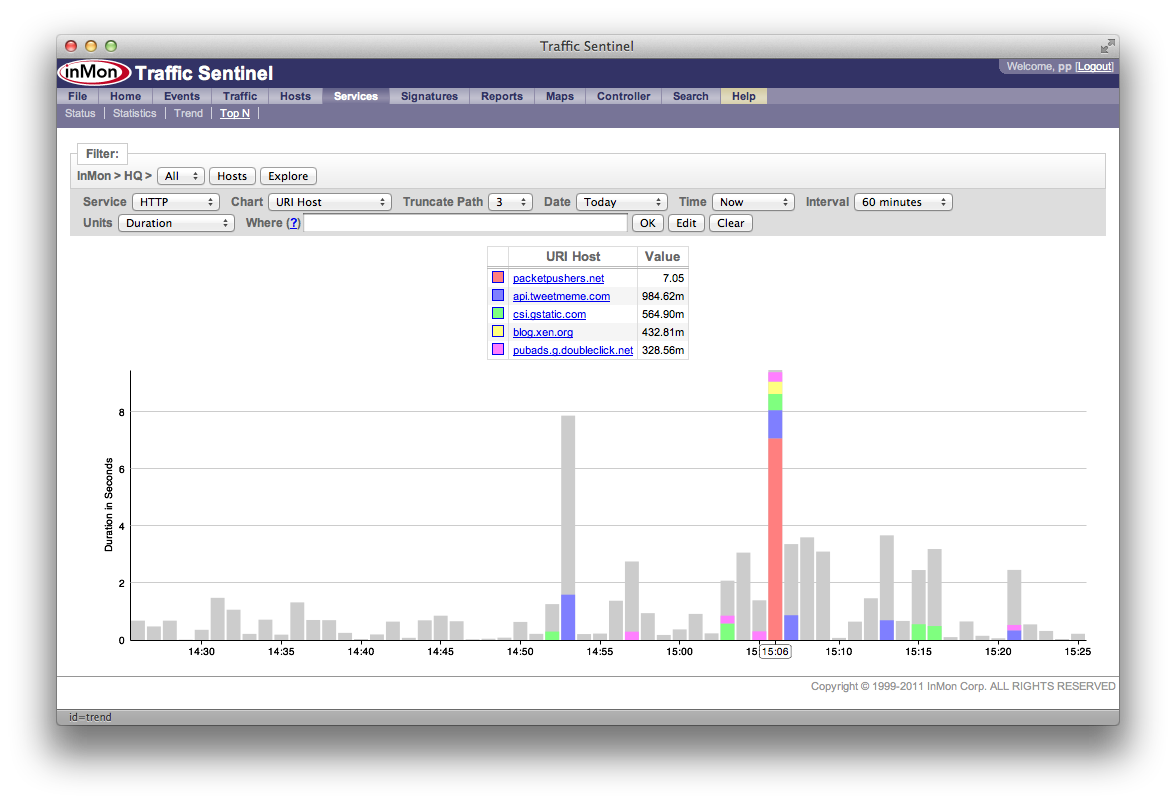
A new extension to the sFlow standard allows web servers, load balancers and other HTTP aware entities to export performance metrics (top URLs, HTTP status, response times ...). There are free, open source, implementations for popular web servers, including Apache, NGINX, Tomcat and node.js.
Traffic Sentinel 6.0 offers a comprehensive and highly scalable suite of tools for thresholding, trending and comparing web servers and examinging the performance of large web server clusters. The ability to directly relate HTTP performance to server and network performance is a vital step towards unifying network, system and application performance management, and towards fully automated, network aware data center optimization.
Monitor Memcache performance
A new to the sFlow standard allows Memcached servers and other memcache aware entities to export performance metrics (top/missed keys, status, response times ...). There is a free, open source, implementation for Memcached.
Traffic Sentinel 6.0 integrates Memcache performance monitoring, along with HTTP, as part of the new application monitoring tool set.
Monitor TRILL
Traffic Sentinel 6.0 decodes TRILL headers to monitor traffic running over TRILL links as well as monitor TRILL specific attributes such as ingress/egress bridge, TRILL options and time-to-live.
Monitor spanning tree
Traffic Sentinel 6.0 decodes and displays information from the spanning tree protocol, displaying root bridges and unicast flooding.