
Announcing InMon Traffic Sentinel 4.0
InMon Traffic Sentinel 4.0 is now available for download. This is a free upgrade for customers who have purchased annual maintenance.
Note: Tutorials have been extensively rewritten for Traffic Sentinel 4.0, including a step by step guide to configuring and using Traffic Sentinel.
Previous release: 3.0
New features include:
- Traffic controller
- Improved layer 2 topology discovery and host location
- Auto-discover on non-sFlow agents
- Performance
- Direct editing of files
- IPv6 agents and agent-ranges
- IPv6 Snort® rule support
- Events-only reports
- ICMP unreachable port
- VPLS decode
- Improved event forwarding
- NetFlow v5 forwarding
- Improved diagnostic tools
Traffic controller
The new Controller can automatically apply priority, rate-limit or block controls based on traffic measurements.
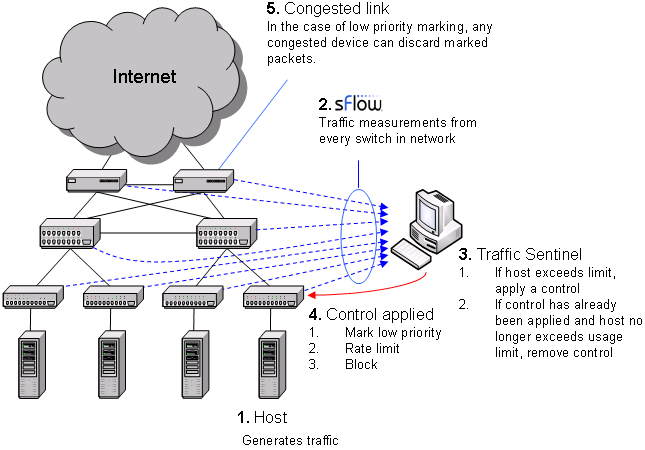
The diagram shows the sequence of actions involved in controlling traffic. The sequence form a "closed-loop control system" designed to maintain network performance by controlling large sources of traffic. In step 1, a host starts generating large amounts of traffic. In step 2, Traffic Sentinel, using the multi-vendor sFlow® standard to continuously monitor traffic throughout the network, quickly detects the increase in traffic from the host and locates the host to the switch port connecting it to the network. In step 3, Traffic Sentinel checks the host's traffic levels against pre-set limits (or quotas) and applies a control if the host is over quota. In step 4, the access switch connecting the host to the network is reconfigured to apply the selected control. Step 5 only applies when using priority controls. A priority control consists of two parts; the first part involves marking packets from the host as low priority at the access switch and the second part occurs when congestion occurs elsewhere in the network and the congested device selectively drops the marked packets, reducing the bandwidth consumed by the marked host. Finally, Traffic Sentinel continues to monitor traffic and when it detects that the traffic from a host is back within acceptable limits, it removes the control.
For more information see Enforcing Usage Quotas.
Improved layer 2 topology discover and host location
Topology discovery has been completely rewritten. The new discovery engine is better at identifying links between switches and is more accurate when locating hosts to switch ports. Port-based VLANs are now automatically discovered and can be displayed in the Traffic>Status pages and in reports.
Auto-discover on non-sFlow agents
Scanning addresses in an Agent-Range will now find all devices that respond to SNMP, not just devices supporting the sFlow MIB. Traffic Sentinel will automatically use SNMP to monitor interfaces on the discovered devices, removing the need to add explicit Agent sections to initiate polling.
Performance
Enhancements to Traffic Sentinel's database and query provide a significant boost to most queries and significantly reduce the amount of memory used when running queries. The new multi-query capability (see Advanced Scripting) is particularly powerful, allowing large batches of queries to be run in almost the time it would take to run a single query.
Direct editing of files
Many files that previously required download/upload operations now support direct editing through the web browser. The Signatures>Configure, File>Configure>XML and File>Logs>etc/config pages all support direct editing.
IPv6 agents and agent-ranges
Traffic Sentinel now supports discovery and monitoring of devices using IPv6. IPv6 agents can be polled using SNMP over IPv6 and Traffic Sentinel can receive sFlow/NetFlow over IPv6.
IPv6 Snort® rule support
The Signatures>Configure file can now contain IPv6 addresses and CIDRs when specifying source/destination address ranges in rules. Any IPv6 CIDRs specified in the configuration will automatically be applied when you use Zones or Groups in rules.
Events-only reports
The Reports>Schedule page now has a Keep option. Setting the value to Events Only is a useful addition for reports that are configured to generate events (such as Security reports). When set this option only saves a copy of the report when an event is generated. Any email recipients will also only receive copies when an event is generated.
ICMP unreachable port
When an attempt is made to connect to a host using a protocol that is not supported by the host, an ICMP port unreachable message is generated. Traffic Sentinel uses sFlow to capture these messages and stores information in a new database field, ICMP Unreachable Port (icmpunreachableport). The ICMP Unreachable Port field is a very useful way to find hosts that are scanning on the network. The new Security>ICMP Port Unreachable query makes use of this data to find hosts that are scanning and the ports that they are trying to access.
VPLS decode
Traffic Sentinel is able to decode VPLS (Virtual Private LAN Service) tunnels and determine the connections and protocols running over the VPLS tunnels. Instead of simply appearing as a large layer 2 flow between a pair of MAC addresses, Traffic Sentinel will display the TCP/IP connection running over the tunnel.
Improved event forwarding
Event forwarding via Email, syslog or SNMP Trap is now configured through the File>Forwarding>Events page. Events can be filtered by severity and type. Syslog events can now be sent directly to a remote syslog server,
NetFlow v5 forwarding
There is a new Format option on the File>Forwarding>Flows page that allows flows to be forwarded as NetFlow version 5. This is useful when exporting to an application that does not support sFlow. For applications that support sFlow, always set the Format to sFlow since sFlow contains more detailed information, is less sensitive to packet loss and contains interface counters as well as flows.
Improved diagnostic tools
The new File>Configure>Status page provides details about the configuration settings that are being applied when monitoring each device. It also provides tools for testing connectivity to devices and detailed status information for troubleshooting.
Links on the File>Status page provide additional information about CPU and disk usage that are helpful for troubleshooting.