
Host Performance
Traffic Sentinel provides a number tools for analyzing host performance.
Setting up host monitoring
There are a few configuration steps needed before Traffic Sentinel can be used to monitor host performance.
1. Host sFlow
Traffic Sentinel relies on hosts to export performance statistics using sFlow. Hosts must be configured to send sFlow to the Traffic Sentinel server on UDP port 6343.
Note: A free, open source, sFlow agent can be downloaded from host-sflow.sourceforge.net.
2. Configure Zones and Groups
Collecting host sFlow agents into Zones and Groups helps navigate large numbers of hosts and allows performance metrics to be rolled up by Group and Zone (see Configuring Traffic Sentinel).
3. Configure Thresholds
Setting thresholds on host performance metrics generates alerts when hosts become overloaded and helps highlight abnormal values that need attention (see Configuring Traffic Sentinel).
Monitoring Hosts
Traffic Sentinel has three tabs under the Hosts menu proving different views on the host performance statistics.
1. Hosts>Status
The Hosts>Status page shows the status of servers throughout the data center.
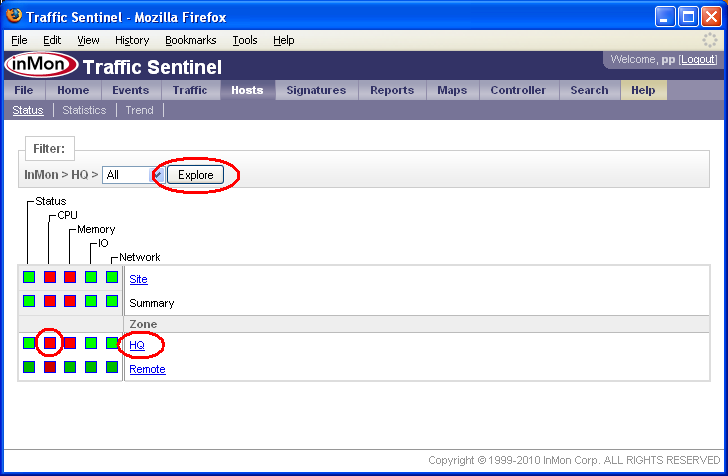
Clicking on squares in the grid will drill-down to show more details about the status.
Clicking on row labels expand detail for the selected group of servers. At any level in the hierarchy you can click on the Explore button to report on statistics for the selected group of servers (see Reporting). At any time you can click on the Hosts>Statistics or Hosts>Trend tabs to examine the performance metrics for the selected servers.
Drilling down to the agents shows the IP Addesses and domain names of each agent reporting host statistics.
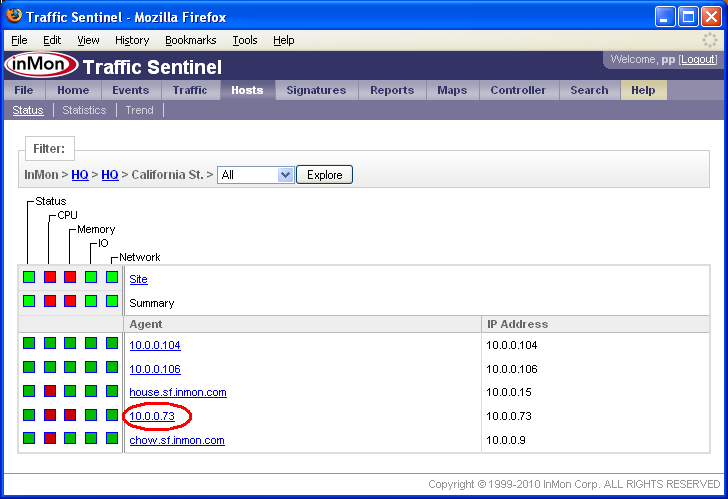
Clicking on an agent shows the servers being reported by the agent.
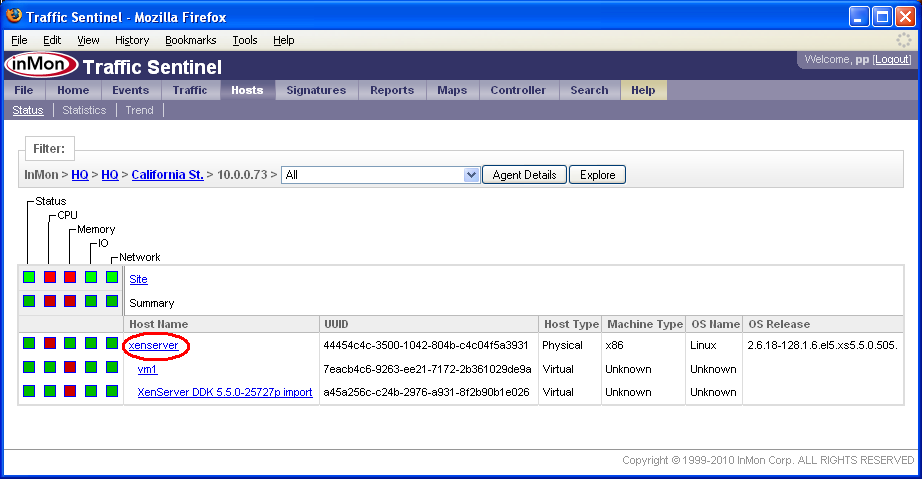
In this case the agent 10.0.0.73 is reporting on one Physical server (xenserver) which contains two Virtual machines, vm1 and XenServer DDK-5.5.0-25727p import.
Note: An agent may report on more than one physical server (e.g. blades in a blade server) and each physical machine may contain multiple virtual machines.
2. Hosts>Statistics
The Hosts>Statistics table shows the servers in the current Filter: path, sorted by a selected metric.
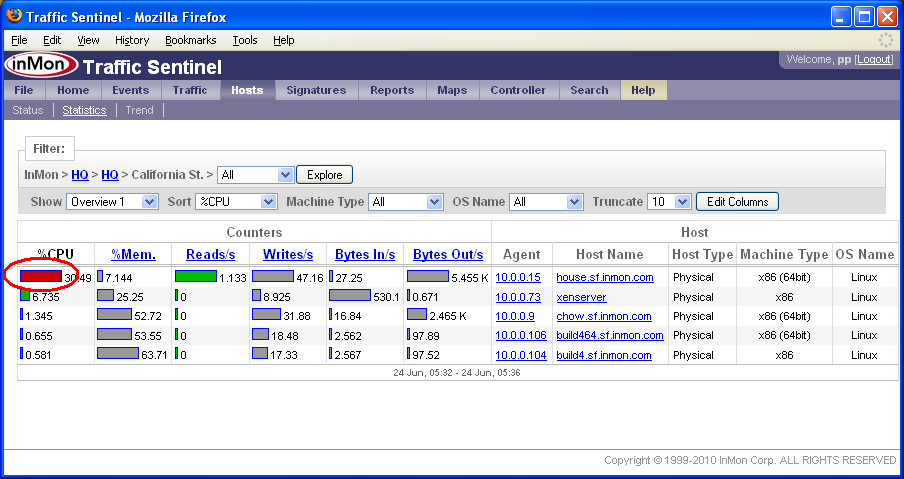
Each row in the table represents a single server. Clicking on a column label sorts the table by that metric. Clicking on a bar in the table drills down to show a Hosts>Trend view of the statistics for the selected sever.
3. Hosts>Trend
The Hosts>Trend page displays a set of trend charts for the servers in the current Filter: path.
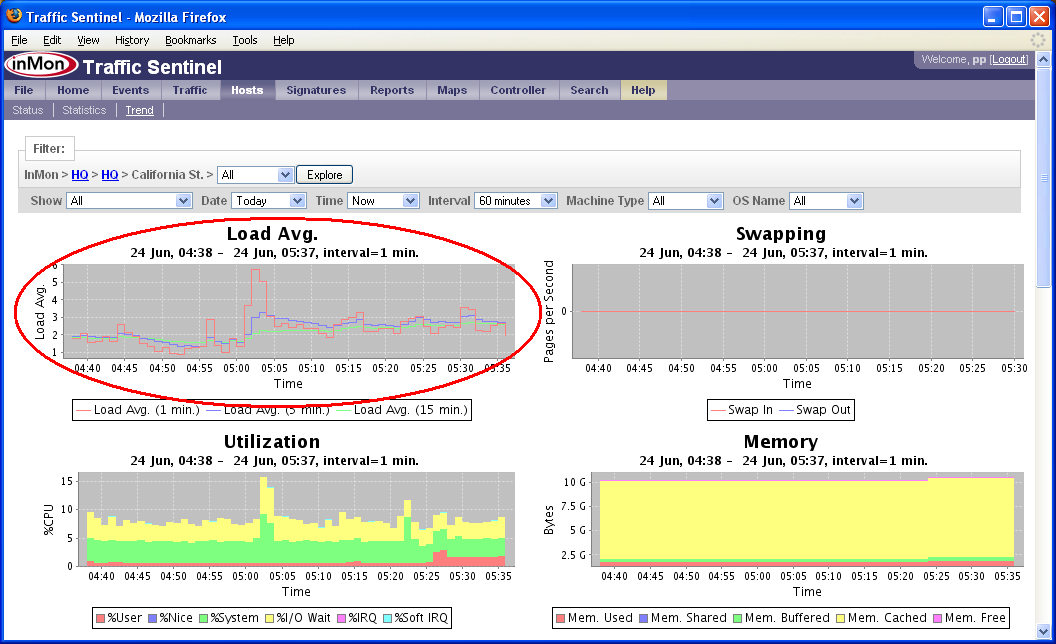
When the Show: setting is set to All the statics represent a rolled up summary of the performance of all the servers in the path.
Click on a chart to break out the members of the group by the selected metric.
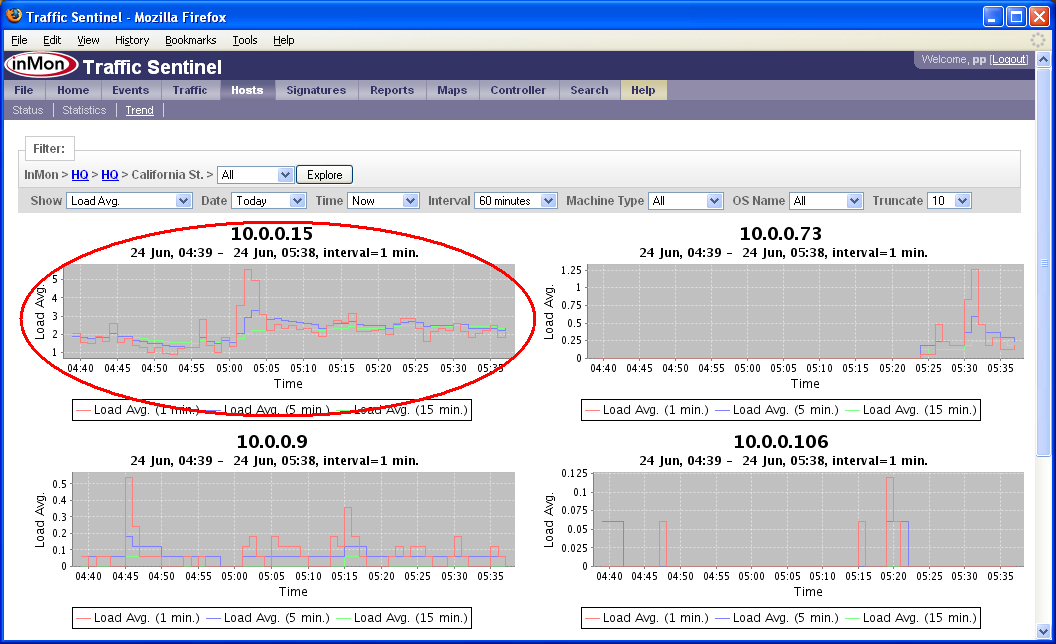
In this view, the Load Avg. chart for each of the agents in the California St. group is shown.
Clicking on a chart drills down to select an agent.
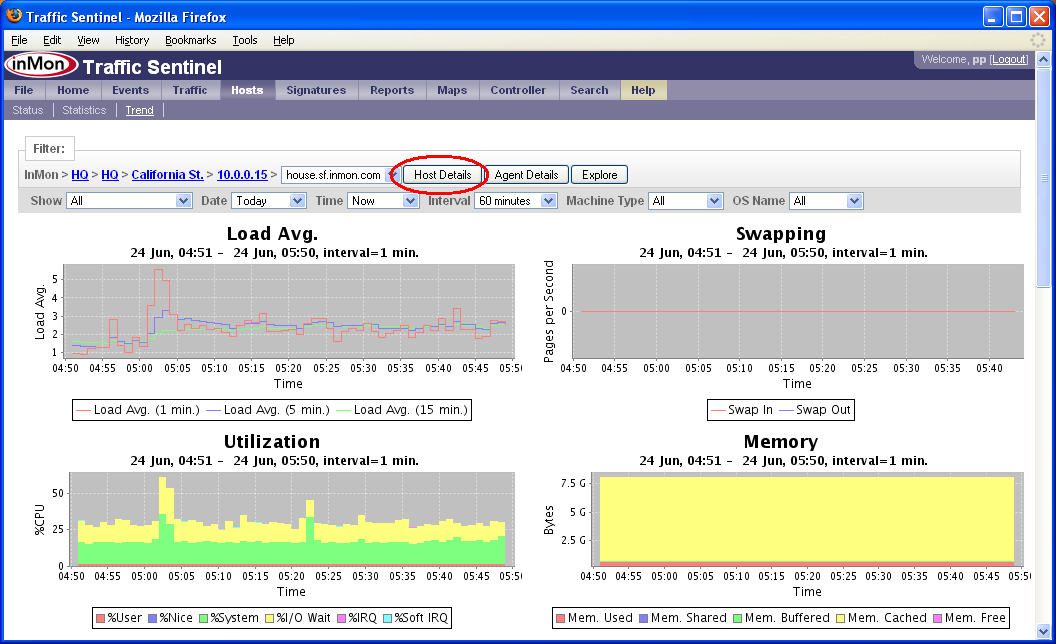
Once you have drilled down to a single physical or virtual server, you can see its performance statistics. Click on the Host Details button to go to the Search>Host page.
Search
The Search>Host page allows hosts to be identified by UUID, or by any of the MAC addresses associated with the host.
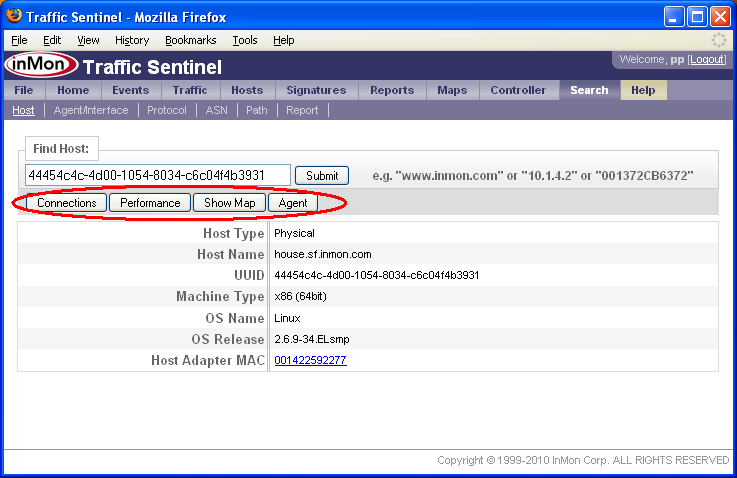
The buttons across the top of the search page provide links to different Traffic Sentinel tools that can be used to analyzer aspects of the host's performance:
- Connections displays network traffic associated with the host.
- Performance displays trend charts showing host performance metrics.
- Show Map displays a Layer 4 Map of the host and the services it provides and consumes.
- Agent displays information about the Agent reporting on the host.
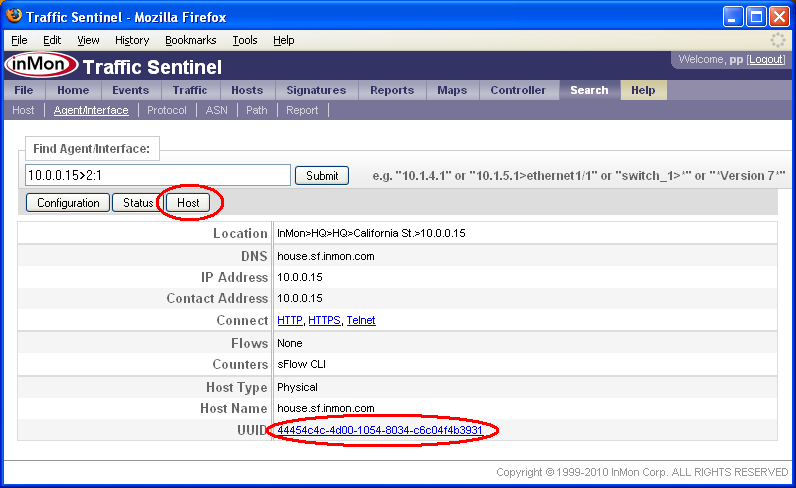
The Search>Agent page displays information about the agent reporting on a host. Clicking on the Host button or a UUID link takes you to the Search>Host page for a host being monitored by the agent.
Reporting
The Reports>Explore page can display long term performance statistics for a host.
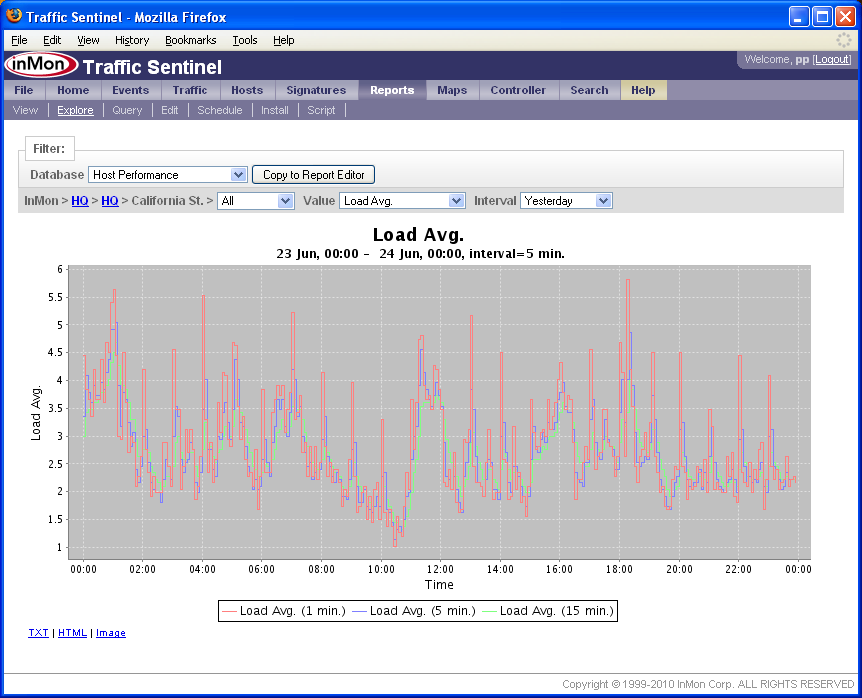
Note: See Querying and Reporting for more information on Traffic Sentinel's reporting functionality.
Traffic
The Traffic>Trend page can be used to display network connections and traffic associated with a host.
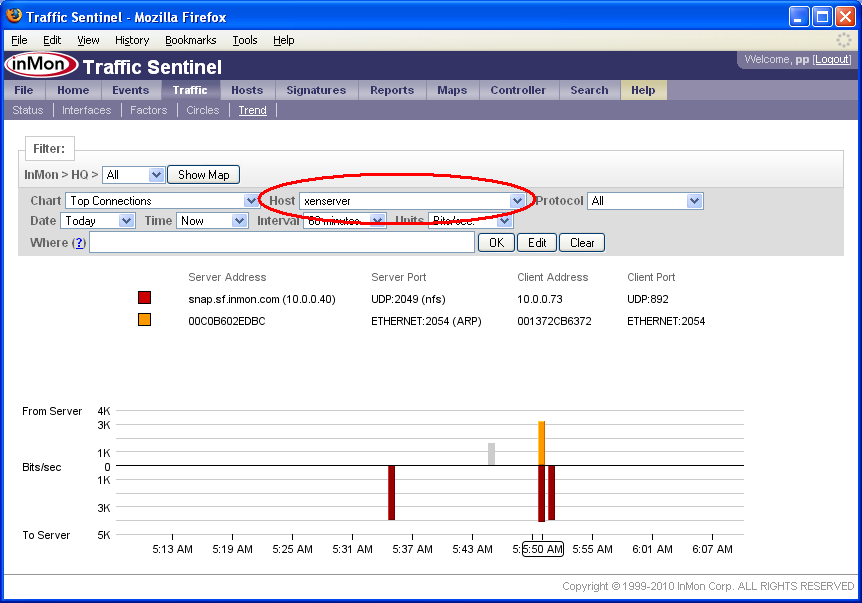
The Host setting in the Filter: bar is used to select individual hosts. In this case traffic associated with the xenserver host is being displayed.
Note: The Host menu displays hosts that have recently been the focus of a Search>Host query.
Maps
The Maps>Layer 4 displays an application dependency map based on real-time traffic measurements.
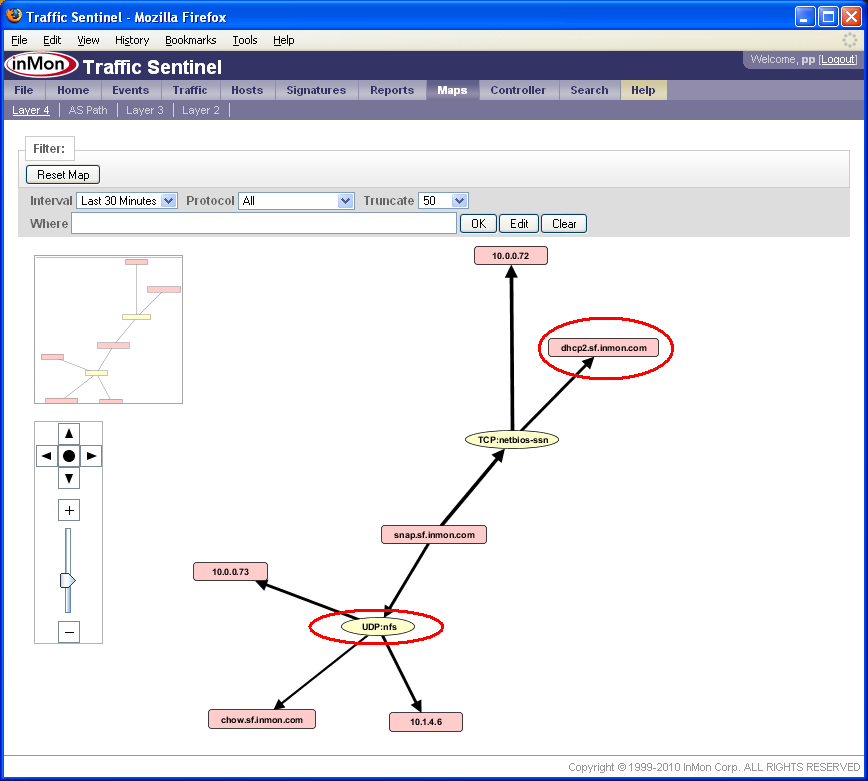
Clicking on protocols or hosts in the map filters on the selected host or protocol. Hovering the mouse over an item in the map displays additional information associated with the element, including links to Search>Host and Search>Protocol results.
| Related Topics |
|