Querying traffic data
1. Introduction
Traffic Server provides an open web-based query interface to the data it collects. There are two repositories of traffic information. The first is the minute by minute traffic data for each interface being monitored. This data is useful for real-time trouble shooting. The second repository contains end-to-end traffic matrix information. This information is useful for usage accounting, profiling applications and security audits.
There are a number of ways in which the web-based interface can be used to make customized queries.
2. Using web-based forms
A number of web-based forms are provided under the Query menu on the left hand side of the Traffic Server web page. These forms are useful for quickly obtaining specific, filtered traffic data. The following forms are available:
- Host, accessing data about specific hosts on the network.
- Interface Counters, accessing historical interface statistics.
- Interface Traffic, accessing minute by minute flow data for each interface.
- Site Traffic, accessing unidirectional hourly traffic matrix data.
- Site Service, accessing bi-directional hourly traffic matrix data.
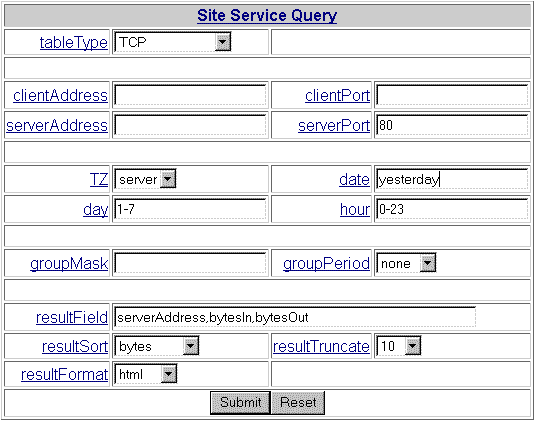
For example, suppose you wanted to quickly identify the busiest web-servers, showing the total bytes sent and received. This information is easily obtained using the Query > Site Service form. Simply fill in the form fields as follows:

There are a few points worth noting about this form. Firstly, the labels on each form field are links to on-line help for that field. For example you could find out about values for the resultField parameter by clicking in its link. The second point to notice is that the field names correspond to values that can be included directly in URL queries. For example, invoking this query is equivalent to requesting the URL:
/its/query/Service?tableType=TCP&serverPort=80&date=yesterday&resultField= serverAddress,bytesIn,bytesOut&resultSort=bytes&resultTruncate=10&resultFormat=html
Finally, the use of relative time (e.g. yesterday) in the date field produces a query that can repeated every day and generate current data.
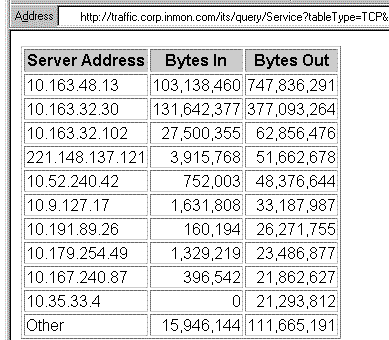
Clicking on the submit button produces the following result:

As well as providing a quick answer to our query, the Address at the top of the web browser can be copied and pasted into any web-capable tool so the query can be repeated. You can save the query using your browser's Favorites menu, repeating the query when needed.
3. Using wget
wget is a simple command line utility that can be used to make http queries. For example, the following steps provide a simple way to extract data to a local file:
- Use Traffic Server Query Site Service form to generate a query, selecting the resultFormat to be csv
- Copy the URL from the result window.
- At a command prompt type: wget -q -O - '<paste URL>' > result.txt
Note Use single quotes around the URL.
Instead of simply saving the result to a file, you could do further processing by piping the result through a script written in awk or Perl. Reports generated in this way can easily be run periodically using cron. This technique often used to extract traffic accounting data from Traffic Server so that it can be loaded into a billing systems or databases.
Note: wget is installed as part of the Traffic Server installation.
4. Perl Scripts
If you are using Perl as your scripting language then you do not need to use utilities such as wget. Perl is able to generate http queries directly and process the resulting data.
There are a number of example Perl Scripts available:
- query.pl - example of extracting data from the historical database.
- minuteQuery.pl - example of pulling data from the real-time minute database.
- entity.pl - example using POST for long http queries, and mapping subnets to name entities.
- bill.pl - extraction of data for billing
Users have also contributed scripts to the Traffic Management mailing list.
5. Using Excel
The following example gives a basic method to generate reports with Excel:
- Make the query in Traffic Server (e.g. using Query > Site Service), using html as the resultFormat, and copy the URL.
- Paste the URL into a text editor (e.g. Notepad).
- Change the first '?' into a newline.
- Save to a '.iqy' file (means "internet query").
- Open that query file in Excel.
Instead of opening a query file in Excel, it is possible to insert multiple queries into a single sheet by selecting the menu items:
Data > Get External Data > Run Saved Query.
Excel can prompt you for parameters and then substitute them into the URL, see this Microsoft document:
http://support.microsoft.com/support/kb/articles/q157/4/82.asp
The following downloads provide examples of using Excel's web query capability:
- traffic.iqy is a query file. Download the file. In Excel select Data->Get External Data->Run Saved Query. Specify traffic.iqy as the query to run and you will be prompted for the different query parameters (or you can link them to cells in your spreadsheet).
- tmquery.xls is a basic query workbook for obtaining tabular results. Experiment with different query parameters and chart the results.
- tmapps.xls demonstrates how queries can be used to create mini applications.
6. Using sFlowTool
sflowtool is a command line utility that allows analysis of raw sFlow datagrams. A number of example scripts that can be used in conjunction with sflowtool can be found at http://www.inmon.com/technology/sflowTools.php. sflowtool is particularly useful if you need to perform detailed packet analysis, filtering and capture. sflowtool can convert traffic data into libpcap format so that tools such as tcpdump can be used to analyze the traces.
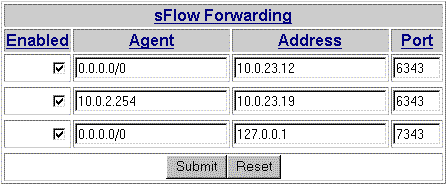
Traffic Server is able to send sFlow information to multiple locations. This capability is accessed via the Server > Forwarding menu on the left of the Traffic Server web page:

In this example, sFlow data from all agents (0.0.0.0/0) is being forwarded to 10.0.23.12 port 6343 (the default sFlow port). sFlow data from the agent 10.0.2.254 is being forwarded to 10.0.23.19 port 6343, and finally sFlow data from all agents is being forwarded to the Traffic Server host (127.0.0.1 = localhost) on port 7343.
WARNING: It is very important not to forward sFlow packets to the Traffic Server host on any of the ports in the range it is listening to (6343 to 6353). This can cause the packets to be looped indefinitely. Make sure you forward to a port that isn't already in use by other applications. A good way to check on port availability is to run sflowtool with the -p option. For example:
sflowtool -p 7343
would return an error if port 7343 were already in use.
Users have also contributed scripts to the Traffic Management mailing list.
Note: sflowtool is installed as part of the Traffic Server installation.
| Related Topics |
|
