Intrusion Detection
Traffic Server makes use of sFlow® to provide intrusion detection capabilities that complement existing firewall functions.
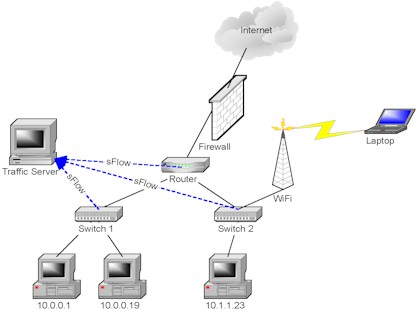 Figure 1 Network with firewall and sFlow
Figure 1 shows some of the elements of a typical site network. Traffic from the Internet passes through a firewall before entering the site. Traffic is then routed to distribution switches, providing connectivity to the computers on the site.
Unfortunately, no firewall provides complete security:
- A new attack may compromise hosts before the firewall rules can be updated.
- Laptops may become compromised when offsite and then infect machines behind the firwall when they are connected to the network.
- Wireless access points may allow intruders into the site. Even if authorised wireless access points are secure, a careless user may attach an unsecured access point to the network.
- Multiple infection vectors, including email, web and plugins make it extremely difficult for the firewall to identify all possible threats.
Security problems behind the firewall can be very hard to detect and isolate. Fortunately, the pervasive monitoring capability of sFlow provides a cost effective way of applying intrusion detection techniques to the traffic throughout the internal network.
Internet worms such as Welchia, Slammer and MSBlaster are a significant threat. This tutorial uses the example of Internet worm detection to demonstrate the intrusion detection capabilities of Traffic Server.
Packet signature analysis
One technique for detecting intrusions is to examine network packets and compare them with signatures of known threats. Snort™ is an open-source intrusion detection tool. The Snort format for defining packet signatures is now a de-facto standard for publishing signatures. Traffic Server's signature engine automatically translates Snort rules into a format that can be applied to sFlow data.
Configuring rules
First, a rules file is constructed by collecting together a set of rules that that are applicable for a particular site. Simply collecting together the thousands of Snort rules that have been defined is not a good strategy. Many of the rules will generate false posives, reducing the value of the monitoring system. In addition, the Snort application is designed to operate in the position of the firewall, examining all the traffic on and off site in order to prevent unauthorized access from outside. In this example, we assume that there is a firewall in place, and our job is to identify security failures where local hosts become compromised.
The file, wormrules.txt, contains six rules selected to identify internal hosts that have become infected by Internet worms. All the rules have been altered from their original format. Instead of triggering on packets from $EXTERNAL_NET to $HOME_NET, we are interested in activity from $HOME_NET. In addition, signature patterns may also need to be modified if they attempt to look too deeply into the packet. The size of packet header exported by sFlow depends on the device, but typically ranges between 100 to 128 bytes. Patterns must be able to match within the header in order for the rules to fire.
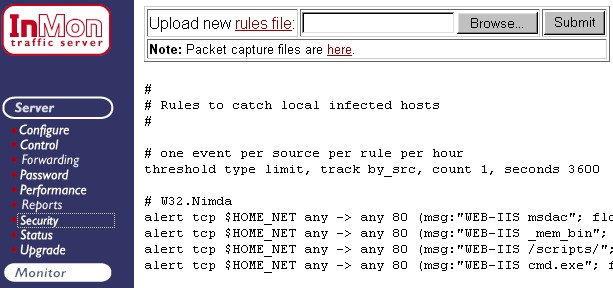 Figure 2 Configuring security rules
Figure 2 shows the Server->Security page used to examine rules and install new rules files. To install a new rules file, simply post it by entering the file name and clicking the Submit button.
Events
Once rules have been installed, any matches are reported as Traffic Server events.
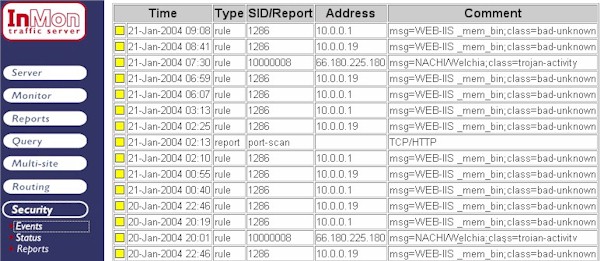 Figure 3 Event log
Figure 3 shows a number of events relating to security rule violations. For
example, the first event identifies host 10.0.0.1 as violating rule
number 1286. The status box ![]() is a link that will pull up additional
information, in this case a list of compromised hosts.
is a link that will pull up additional
information, in this case a list of compromised hosts.
Compromised hosts
Traffic Server maintains a list of hosts generating packets that violate the security rules.
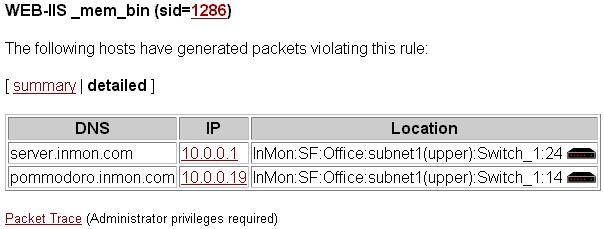 Figure 4 Compromised hosts
Figure 4 shows the list of hosts violating rule 1286. Clicking on any of the IP addresses brings up a profile the host showing its activity over the last minutes, hours and weeks. This information provides a useful audit trail, since the log files on the host itself may have been deleted when the host was compromised. The host traffic reports identify additional services that may have been compromised and any communication with other hosts.
Clicking on the switch icon  connects to the
switch in order to take corrective action, disabling a port, or
applying an access control.
Finally, clicking on the Packet Trace link allows detailed packet information to be examined.
Packet trace
Packet trace information can be very useful for documenting an attack. Examining packet traces allows rules to be refined to avoid false positives and provides the information needed to develop new rules when a new attack is detected.
 Figure 5 Packet capture
Figure 5 shows that two packet capture files exist for rule 1286. Clicking on a file will allow you to download the file and examine it using any protocol analysis application. Clicking on one of the tcpdump options displays the packet decodes.
View decode
Tcpdump is a popular utility for decoding and displaying packet traces.
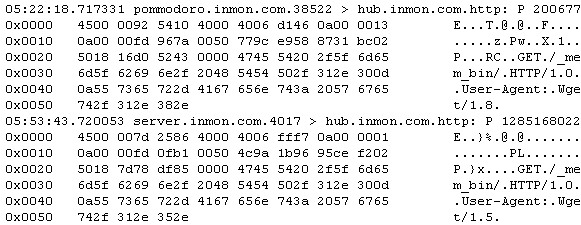 Figure 6 Detailed tcpdump
Figure 6 shows details of the packets identified as suspicous by the rule. The packets are clearly http requests containing the _mem_bin string in the URL.
Traffic pattern analysis
Traffic pattern analysis is a good complement to packet signature detection. The overall behavior of a host may indicate a problem, even if none of its individual transactions would trigger a packet signature rule. Traffic pattern analysis can be a powerful technique for identifying new threats. For example, Internet worms scan the network to identify further hosts to compromise. A new worm might not trigger any packet signatures, but it is likely to exhibit scanning behavior.
Reports
Traffic Server constructs a detailed end-to-end traffic database that can easily be queries to identify scanning behavior.
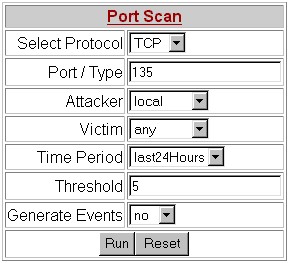 Figure 7 Port scan query
Figure 7 shows a Reports->Interactive form for identifying scanning behavior. In this case we are looking for scanning behavior by internal hosts using TCP port 135. This type of scanning is characteristic of worms trying to exploit vulnerabilities is Microsoft's RPC protocol.
Scanning report
A scanning report ranks hosts by the number of unique addresses that they try to contact. Most normal machines communicate with a fairly small number of servers. A host infected with a worm may try to communicate with millions of addresses of the period of a day.
 Figure 8 Port scan report
Figure 6 shows a port scan report identifying hosts likely to be infected with the a worm, since they appear to be scanning for vulnerabilities in Microsoft's RPC protocol.
| Related Topics |
|
