
The image below shows the performance of a cluster of 1,000 servers. The charts trend combined measurements from all the servers to give a picture of the overall performance of the cluster. The charts simplify management by treating the cluster as if it were a single server with 8,000 processors, 16 terabytes of memory and 1 terabits/second of network bandwidth.
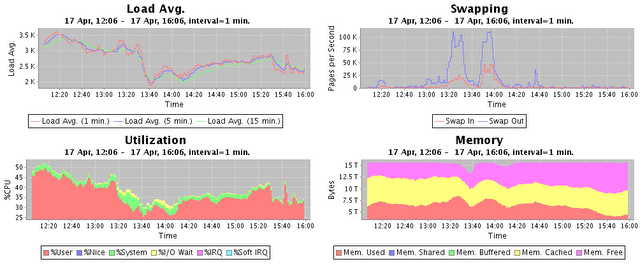
If performance problems in the cluster are detected, in this case an increase in swapping activity, the performance of each server in the cluster can easily be compared.