Announcing InMon Traffic Sentinel 8.1
August 2017: InMon Traffic Sentinel 8.1 is now available for download. This is a free upgrade for customers who have purchased annual maintenance.
Previous release: 8.0
New features include:
- Circles Zoom
- Up to the minute counters
- Linux systemd services
- Delay, loss and jitter
- Bookmark interactive pages
- NetFlow configuration troubleshooting
- New authentication role: Analyst
- REST API browser
Circles Zoom
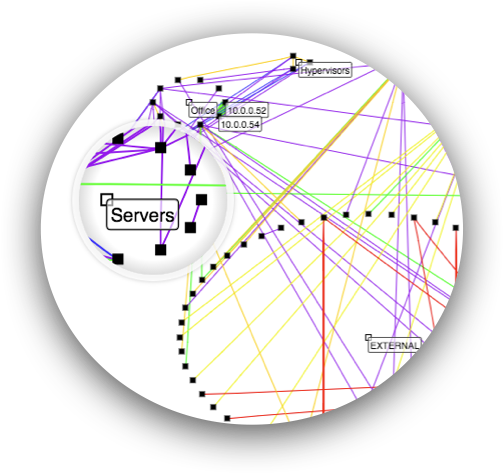
A magnifying glass effect makes selecting nodes and traffic lines easier on the Circles page::
Up to the minute counters
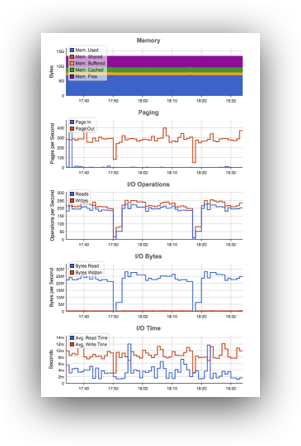
Both streaming telemetry and polled counters are now handled differently so that there is always a value in the latest minute. This makes it easier and more efficient to feed the numbers to other tools, and it cleans up dashboard charts that may be representing thousands of counters:
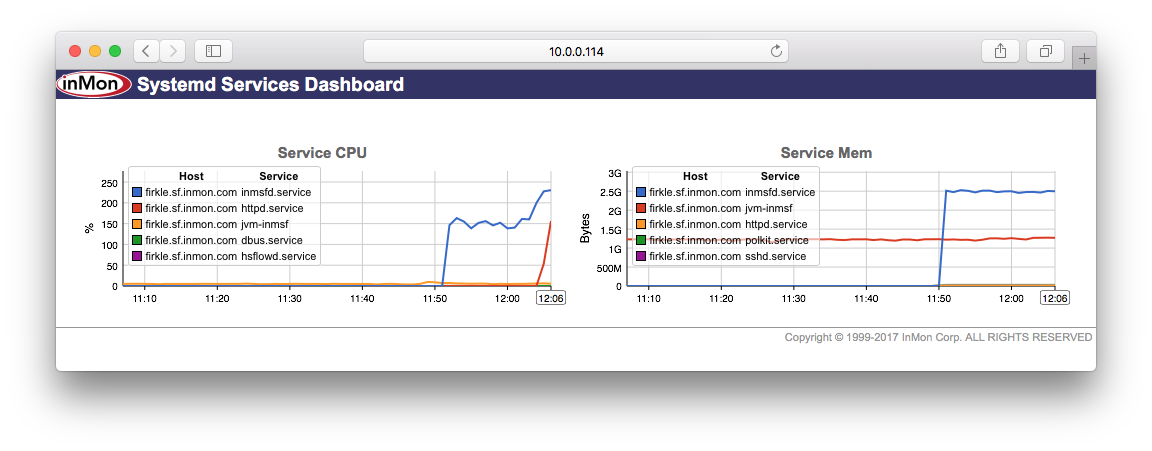
Linux systemd services
Monitoring individual services within Linux hosts across the whole network provides a deeper level of visibility into server performance. The services appear in Traffic Sentinel in the same way as virtual machines, Docker containers or Java JVMs. The shared namespace makes this a powerful way to look for hotspots and profile performance network-wide. This requires hsflowd 2.0.7 or later on the servers with the "systemd{}" feature enabled.
Delay, Loss and Jitter
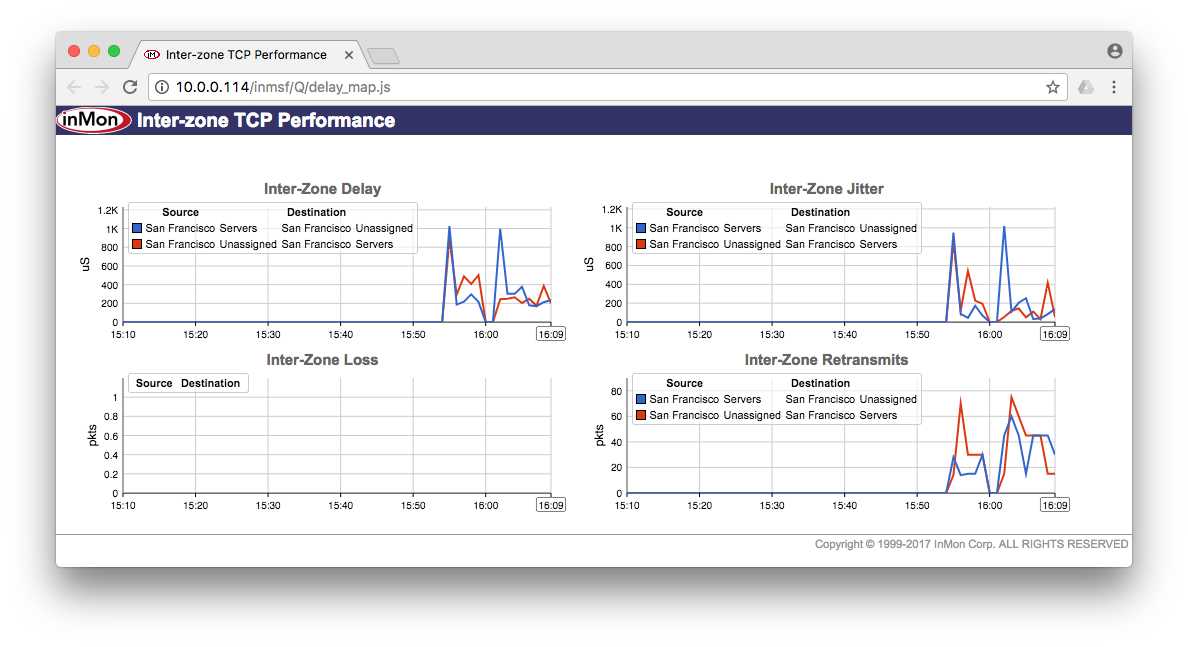
Accurate monitoring of end-to-end delay loss and jitter usually requires hardware assistance from network devices or probes. However the client and server TCP-connection endpoints in your network are estimating these values all the time. With hsflowd 2.0.5 or later running on your Linux hosts those measurements are collected as part of the sFlow feed. You can now profile the delay seen by real traffic without adding any extra test traffic to the network load.
Bookmark interactive pages
Interactive pages such as Traffic>TopN can now be bookmarked with all current settings captured in the URL. Just click the new icon in the top right hand corner. The resulting URL can then be saved or shared by email or IM.

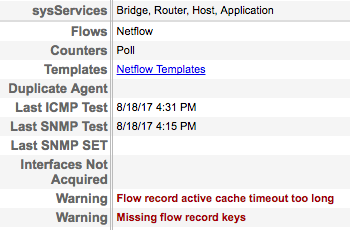
NetFlow configuration troubleshooting
NetFlow and IPFIX monitoring sources require extensive configuration, and there are a number of common errors or omissions that affect data collection in Traffic Sentinel. In many cases Sentinel can detect these misconfigurations and now they are highlighted as warnings under File>Configure>Status.
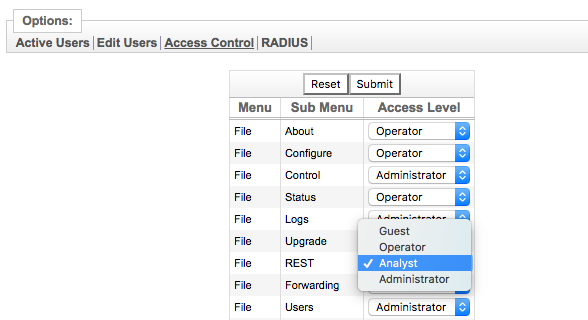
New authentication role: Analyst
In addtion to Administrator, Operator and Guest, you can now designate a user as Analyst. This is intended for users who may be setting up dashboards and reports for others, and who therefore need full access to pages such asFile>REST and Reports>Schedule:
REST API Browser
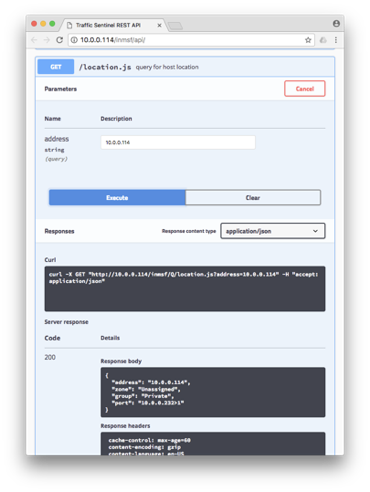
A new "API" button on the File>REST page will launch the Open API browser tool. This makes it easier to test and experiment with the scripts that you have added there:
