
Virtual Probe: User Guide
The guide provides sample installation and configuration settings for using the InMon Virtual Probe with VMWare® and Xen® servers. The probe should work with other virtualization software provided that there are devices supporting the pcap (packet capture) interface that the probe uses to monitor traffic on each virtual switch.
The following diagram shows the elements of the monitoring solution:
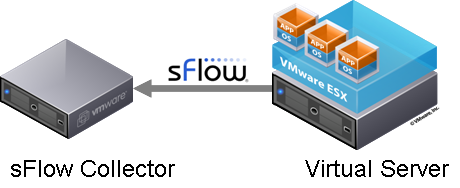
The InMon Virtual Probe software is installed on a virtual server hosting one or more virtual machines. The probe sends sFlow® data to an sFlow collector; sFlowTrend or Traffic Sentinel. The collector analyzes the sFlow data and displays information on the network traffic within the virtual server.
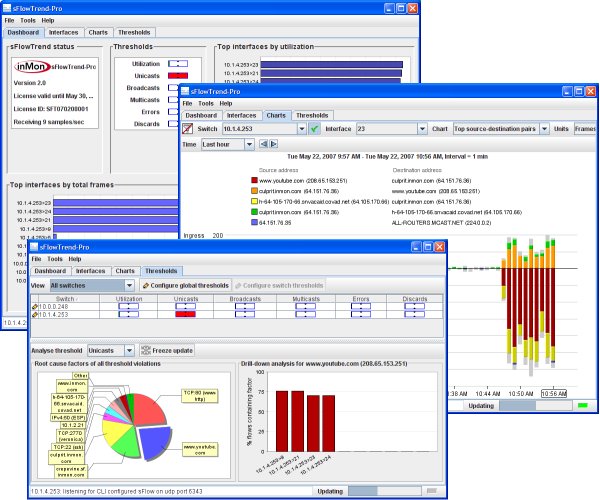
The following screen captures from sFlowTrend demonstrate the visibility into traffic flows, bandwidth utilization and trends that an sFlow collector will provide:
In order to understand how to install and configure the Virtual Probe software, it helps to understand how virtual networking is architected. The following diagram shows the basic elements of a typical virtual server installation:
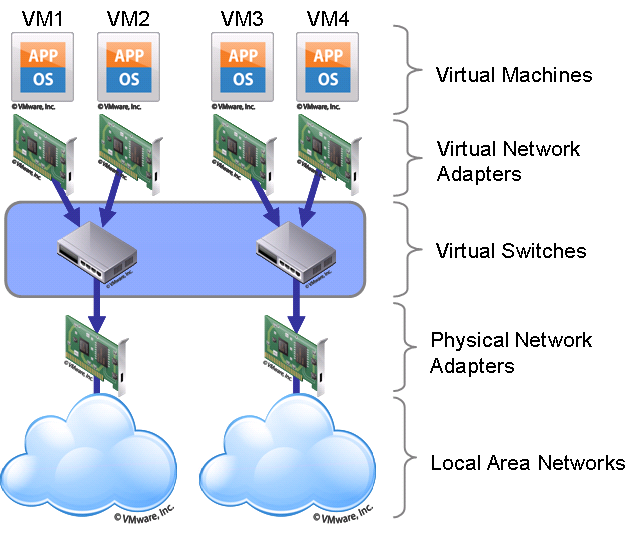
The diagram shows four virtual machines (VM1,VM2,VM3 and VM4) hosted on the server. The server has two physical network adapters used as uplinks for two virtual switches. VM1 and VM2 are connected to the first virtual switch and VM3 and VM4 are connected to the second virtual switch. The Virtual Probe software is designed to monitor traffic on the virtual switches and export the same sFlow data that you would get if they were physical switches.
Deployment
The location of the probes and their configuration depend on the architecture of the virtual server being monitored. This document provides deployment examples for VMWare and Xen virtual servers.
VMWare
If you are using VMWare, install the InMon Virtual Probe software on one of the virtual machines attached to each virtual switch. The software requires a Linux virtual machine, so if you don't already have a Linux VM attached to the virtual switch, you will need to create one. Make sure that any ports used by the probe for monitoring are configured as mirror or SPAN ports (see VMWare Virtual Networking Concepts).
In this example suppose we install the probe software on VM1 and VM3. The configuration for the probe on VM1 would be:
sflow {
  # The agent IP is used to identify this sFlow source
  # The agent IP should be distinct from any virtual machine IP
  # addresses and ideally the address will be reachable from the
  # sFlow collector and respond to ICMP echo (ping) tests.
  # In this example, use the address associated with the server's DNS name
  agentip = 10.0.0.10

  collector {
    # ip address of sFlow Collector
    ip = 10.0.0.1
  }

  virtualswitch {
    pcap {
      # the device on VM1 that can mirror traffic
      # from the virtual switch
      device = eth0
    }

    # speed of physical network adapter on the server
    # connecting this virtual switch to the local area network
    # 1Gbps
    uplink {
      mac = 00:14:22:59:22:77
      ifspeed = 1G
    }

    # VM1
    virtualinterface {
      mac = 00:0c:29:c3:c2:be
    }

    # VM2
    virtualinterface {
      mac = 00:0c:29:ac:eb:3e
    }
  }
}
The configuration for the probe on VM3 would be:
sflow {
  # The agent IP is used to identify this sFlow source
  # The agent IP should be distinct from any virtual machine IP
  # addresses and ideally the address will be reachable from the
  # sFlow collector and respond to ICMP echo (ping) tests.
  # In this example, use the address associated with the server's DNS name
  agentip = 10.0.0.10

  # We have split monitoring between two virtual machines
  # Setting the startifindex and startsubagentid variables avoids
  # number clashes when the two sFlow streams are combined at the
  # sFlow collector. An alternative solution would be to allocate
  # differenet agentip values to the two probes (possibly the
  # IP addresses corresponding to two physical network adapters
  # on the server.

  # an sFlow subagent is an autonomous source of sFlow data
  # the default is 0, so setting to 1 here avoids a clash with
  # the probe on VM1
  startsubagentid = 1

  # Interfaces are numbered sequencially based on their position
  # in the configuration file (starting at ifindex = 1).
  # The configuration file for VM1 defined 3 interfaces (1 uplink and
  # 2 virtual interfaces). We could set the startifindex to 4, but then
  # we would have a clash if another virtual machine were added to
  # the probe on VM1, starting at 100 gives some additional headroom
  startifindex    = 100

  collector {
    # ip address of sFlow Collector
    ip = 10.0.0.1
  }

  virtualswitch {
    pcap {
      # the device on VM3 that can mirror traffic
      # from the virtual switch
      device = eth0
    }

    # speed of physical network adapter on the server
    # connecting this virtual switch to the local area network
    # 1Gbps
    uplink {
      mac = 00:14:22:59:22:78
      ifspeed = 1G
    }

    # VM3
    virtualinterface {
      mac = 00:0c:29:ef:3a:69
    }

    # VM4
    virtualinterface {
      mac = 00:0c:29:9f:19:5e
    }
  }
}
An alternative strategy for monitoring both virtual switches would be to add a second virtual adapter to one of the virtual machines so that it would be connected to both virtual machines. Suppose we added a second adapter to VM1 connecting it to the second switch.
The configuration for the probe on VM1 would be:
sflow {
  # The agent IP is used to identify this sFlow source
  # The agent IP should be distinct from any virtual machine IP
  # addresses and ideally the address will be reachable from the
  # sFlow collector and respond to ICMP echo (ping) tests.
  # In this example, use the address associated with the server's DNS name
  agentip = 10.0.0.10

  collector {
    # ip address of sFlow Collector
    ip = 10.0.0.1
  }

  # first virtual switch
  virtualswitch {
    pcap {
      # the device on VM1 that can mirror traffic
      # from the first virtual switch
      device = eth0
    }

    # speed of physical network adapter on the server
    # connecting this virtual switch to the local area network
    # 1Gbps
    uplink {
      mac = 00:14:22:59:22:77
      ifspeed = 1G
    }

    # VM1
    virtualinterface {
      mac = 00:0c:29:c3:c2:be
    }

    # VM2
    virtualinterface {
      mac = 00:0c:29:ac:eb:3e
    }
  }

  # second virtual switch
  virtualswitch {
    pcap {
      # the device on VM1 that can mirror traffic
      # from the second virtual switch
      device = eth1
    }

    # speed of physical network adapter on the server
    # connecting this virtual switch to the local area network
    # 1Gbps
    uplink {
      mac = 00:14:22:59:22:78
      ifspeed = 1G
    }

    # VM3
    virtualinterface {
      mac = 00:0c:29:ef:3a:69
    }

    # VM4
    virtualinterface {
      mac = 00:0c:29:9f:19:5e
    }
  }
}
Note: Depending on your environment, you may choose to install the Virtual Probe software on an existing virtual machine or you may want to create a new virtual machine dedicated to network monitoring.
Xen
If you using are using Xen/XenServer, KVM or VirtualBox you should consider using the Open vSwitch as your virtual switch since it includes integrated sFlow support along with a number of other advanced management features. The Open vSwitch is the default networking stack on XenServer 6.0.
If you choose to use the Virtual Probe, install the software on the server operating system, not on the virtual machines (see Xen Networking).
Suppose the two bridges are xenbr0 and xenbr1, the configuration for the probe would be:
sflow {
  # The agent IP is used to identify this sFlow source
  # The agent IP should be distinct from any virtual machine IP
  # addresses and ideally the address will be reachable from the
  # sFlow collector and respond to ICMP echo (ping) tests.
  # In this example, use the address associated with the server's DNS name
  agentip = 10.0.0.10

  collector {
    # ip address of sFlow Collector
    ip = 10.0.0.1
  }

  # first virtual switch
  virtualswitch {
    pcap {
      # the Xen bridge device for the first switch
      device = xenbr0
    }

    # speed of physical network adapter on the server
    # connecting this virtual switch to the local area network
    # 1Gbps
    uplink {
      mac = 00:14:22:59:22:77
      ifspeed = 1G
    }

    # VM1
    virtualinterface {
      mac = 00:0c:29:c3:c2:be
    }

    # VM2
    virtualinterface {
      mac = 00:0c:29:ac:eb:3e
    }
  }

  # second virtual switch
  virtualswitch {
    pcap {
      # the Xen bridge device for the second switch
      device = xenbr1
    }

    # speed of physical network adapter on the server
    # connecting this virtual switch to the local area network
    # 1Gbps
    uplink {
      mac = 00:14:22:59:22:78
      ifspeed = 1G
    }

    # VM3
    virtualinterface {
      mac = 00:0c:29:ef:3a:69
    }

    # VM4
    virtualinterface {
      mac = 00:0c:29:9f:19:5e
    }
  }
}
Installation
Download the Virtual Probe software, vsprobe.tgz, and copy the file on to the target system. The following commands will build and install the software:
tar -xvzf vsprobe.tgz
cd vsprobe/src
make
su
make install
Once the software is installed you need to edit the configuration file, /etc/vsprobed.conf. See Deployment for sample configurations. For a complete list of configuration options see Configuration.
Once configured, the following command will start vsprobed:
/etc/init.d/vsprobed start
The following command will ensure that vsprobed will automatically start when the system is rebooted:
chkconfig vsprobed on
If you change the configuration file you will need to signal vsprobed to reread the configuration file:
kill -HUP `cat /var/run/vsprobed.pid 2>/dev/null`
Finally, the following command will stop vsprobed:
/etc/init.d/vsprobed stop
Note: The vsprobed uses the syslog service to log messages, so you should check /var/log/messages if there are problems.
Configuration
The /etc/vsprobed.conf file is comprised of nested sections. Each section can contain attributes and other sections. The examples in this document describe typical configurations. The following table lists all the available configuration settings:
| Parent | Section | Attribute | Default | Description |
|---|---|---|---|---|
| sflow | agentip | IP address used to identify probe | ||
| sflow | packetsamplingrate | 400 | The sampling rate used to capture flow samples | |
| sflow | counterpollinginterval | 30 | The number of seconds between successive counter samples | |
| sflow | firstifindex | 1 | Initial index to use when numbering interfaces | |
| sflow | firstsubagentid | 0 | Initial sub-agent id to use when numbering sub-agents | |
| sflow | collector | ip | IP address of the collector | |
| sflow | collector | udpport | 6343 | The UDP port on the collector used to receive sFlow datagrams |
| sflow | virtualswitch | The virtual switch has no attributes | ||
| virtualswitch | pcap | device | The mirror/span port device to get packets crossing the virtual switch | |
| virtualswitch | pcap | headerbytes | 128 | Number of bytes of packet header to export |
| virtualswitch | pcap | promiscuousmode | 1 | Open the device in promiscuous mode |
| virtualswitch | uplink | mac | The MAC address of the physical adapter connecting this virtual switch to the local area network | |
| virtualswitch | uplink | ifspeed | 0 | The speed (bits/s) of the physical adapter connecting this virtual switch to the local area network |
| virtualswitch | uplink | iftype | 6 | The SNMP ifType of the uplink |
| virtualswitch | virtualinterface | mac | The MAC address associated with the virtual interface | |
| virtualswitch | virtualinterface | ifspeed | 0 | The speed (bits/s) of the virtual interface |
| virtualswitch | virtualinterface | iftype | 6 | The SNMP ifType of the virtual interface |
Support
Please contact VirtualProbe@inmon.com with questions, suggestions or comments.