Table of Contents
The dashboard is the screen displayed when sFlowTrend-Pro is first launched. The purpose of the dashboard is to give a summary of the overall status of the network, to help you identify problems quickly. The dashboard contains three main types of information:
The overall status of sFlowTrend-Pro.
The status of the top-level thresholds.
Charts showing the interfaces in the network reporting the largest values of utilization, frames, and errors and discards.
The status section of the dashboard shows a summary of the overall system, which can be useful for basic troubleshooting.
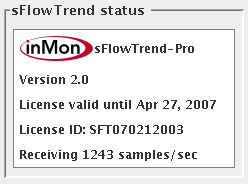
Some of the information shown:
To the right of the InMon Corp. logo is the product name. This should be sFlowTrend-Pro if you are running sFlowTrend-Pro, or sFlowTrend if running basic sFlowTrend. Also, if you are running sFlowTrend-Pro, information about the current license is shown, including the expiry date, and the license ID number. If you have multiple copies of sFlowTrend-Pro, the license ID is useful if you need to refer to the license you are running when you are using the InMon customer portal (http://www.myinmon.com).
The current rate of incoming samples is shown. This number includes only samples that actually reached sFlowTrend-Pro, and are coming from enabled switches. If you are seeing no data in sFlowTrend-Pro, this number can help you determine why (see Section 7.1, “Troubleshooting sFlowTrend-Pro”).