Three 'top interfaces' charts are provided on the dashboard.
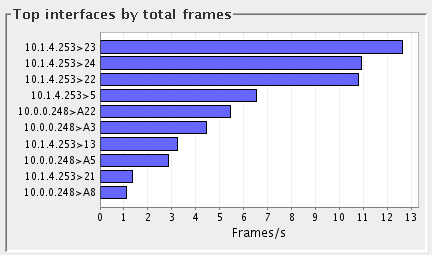
These show, in bar chart format, the top 10 switch interfaces sorted by utilization, total frames (unicasts, multicasts and broadcasts), and errors and discards. The bar shows the average over the previous minute. These charts are designed to give you a summary view of the busiest interfaces, or interfaces which are experiencing the highest number of issues. Clicking on any of the bars allows you to quickly drill-down to the traffic charts for that specific interface.