3.3. Changing the time selection 
| ||
|---|---|---|
| Prev | Chapter 3. Charts | Next |
sFlowTrend-Pro stores a history of traffic data (see Section 8.3, “Custom configuration” for information on configuring the length of history stored). The Time selector allows you to select the period in the history for which data is to be displayed. Since sFlowTrend stores one hour of data, the Time selector is not available and sFlowTrend always displays the last hour of data.
A time selection is defined by a start and end time, and an interval size. The interval size defines the granularity of the data displayed. For example Tue 10 Apr, 2007 01:00 - Tue 10 Apr, 2007 05:59, Interval = 2 mins, defines a 6 hour time period, with data points for each 2 minute interval in the time period. The Time selector includes the following time selections:
The
Time
selector also includes back
 and forward
 buttons that can be used to view data for the previous or
next time period. For example if the time selection is
Last 6 hours
and the current time is Tue 10 Apr, 2007 12:53, clicking on
the back arrow will cause the previous 6 hours of data,
ending at Tue 10 Apr 2007, 06:53, to be displayed (using the
Custom
time selection). The back and forward buttons will be
inactive if the current time selection is at the beginning
or the end of the stored data.
buttons that can be used to view data for the previous or
next time period. For example if the time selection is
Last 6 hours
and the current time is Tue 10 Apr, 2007 12:53, clicking on
the back arrow will cause the previous 6 hours of data,
ending at Tue 10 Apr 2007, 06:53, to be displayed (using the
Custom
time selection). The back and forward buttons will be
inactive if the current time selection is at the beginning
or the end of the stored data.
When a non-custom time period is selected, the displayed chart will be automatically updated when the next data point is available, thus displaying a rolling window of data. The Progress indicator will show when the chart will next be updated.
When you choose a time selection which has an interval size greater than 1 minute, the Progress indicator will have two parts. The upper part will show progress through the current minute, whilst the lower part will show progress through the chosen interval (ie how long until the next data point will be available).
The Custom time selection gives full flexibility in accessing the stored historical data.
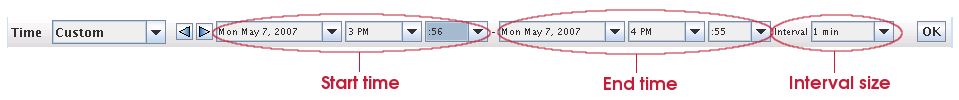
Use the date, hour, minute, and interval selectors to set the desired start and end times and interval size, then click the button. to cause the chart for the selected time period to be displayed.
![[Note]](img/note.png) |
Note |
|---|---|
There is a maximum number of data points that can be displayed in a chart, so small interval size selections will not be available for long time period selections. |
When the Custom time selection is used, the charts are static and are not updated as more data becomes available.