Table of Contents
Thresholds allow you to quickly identify specific problems in your network. When you set a threshold, you are identifying what is considered normal traffic levels for a switch or interface. If that traffic level is exceeded, then the threshold fires, and is highlighted for further investigation or action.
Thresholds are configured and monitored on the Thresholds tab in sFlowTrend-Pro.
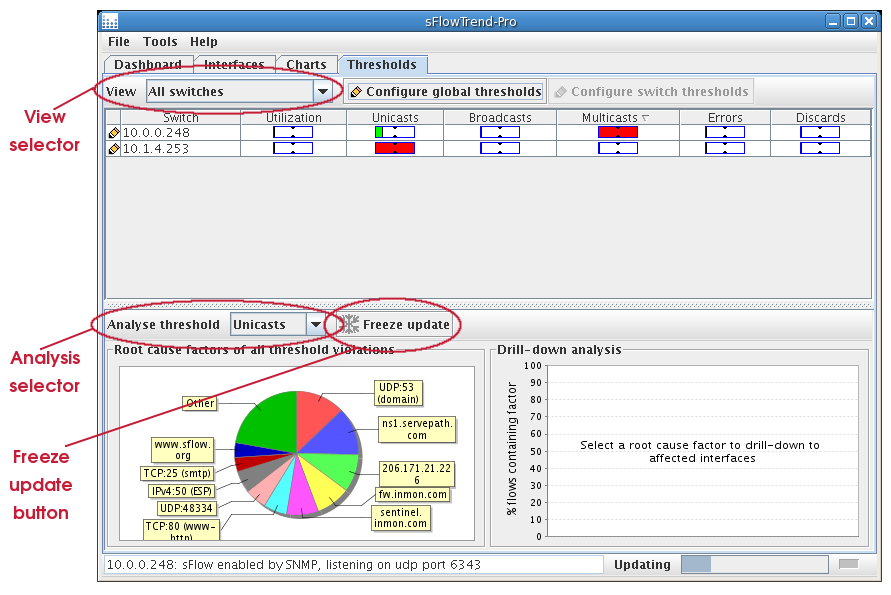
The top half of the window allows you to view the current status (from the previous minute) of different thresholds (see Section 5.1, “Viewing thresholds”). The bottom half of the screen can help in determining the root cause of a threshold violation, for the thresholds currently being displayed (see Section 5.4, “Root cause analysis”).
You can view and configure the thresholds for all switches, or for all interfaces on a specific switch. Use the View selector to select the view that you would like. The options are:
- All Switches
- Displays a table of thresholds for each switch.
- All Interfaces
- Displays a table of thresholds for every interface on each switch.
- Customised thresholds
- Displays only the thresholds for switches or interfaces that have been customised (see Section 5.3, “Defining thresholds”).
- Switch name or address
- If you select a specific switch (by name or IP address, depending on the switch naming policy configured in → ), the thresholds for each interface on that switch are displayed.
The current threshold values are shown in the table, in the top half of the window. Each column can be sorted by clicking on the header column. If you click on a column containing thresholds, then the column will be sorted by the current threshold values in the column. This provides an easy way to find the thresholds with the highest values (ie, those that are 'most exceeded').