The bottom half of the thresholds window allows you to analyse the cause of a threshold violation.
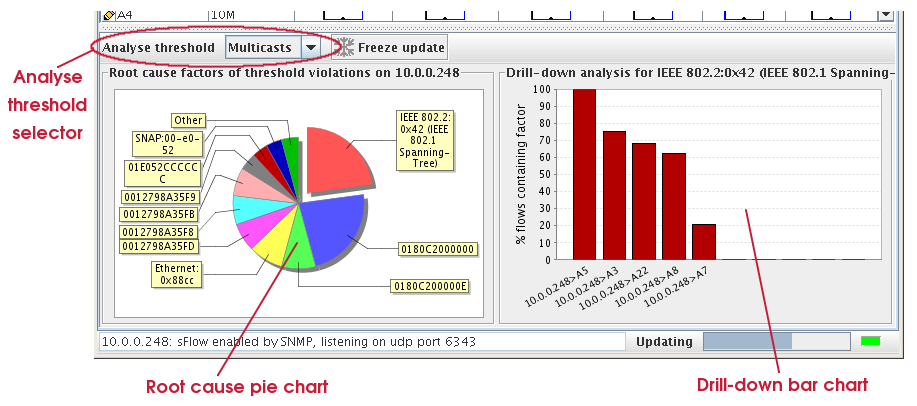
The pie chart on the left shows the root cause factors of threshold violations. These are the addresses and TCP/UDP ports that were seen most often across the interfaces with a threshold violation (marginal or critical). The chart shows the top ten factors. The scope of the interfaces being analysed is the same as the thresholds being viewed in the top half of the window. So, if All switches is selected in the View selector, then the chart will show the root cause factors for threshold violations on all interfaces. Similarly, if one specific switch is being viewed, the root cause factors will be for all interfaces on that switch.
From the set of interfaces being analysed, the specific threshold to determine the root cause factors for, is selected using the Analyse threshold selector. The thresholds for utilization, unicasts, broadcasts and multicasts can be analysed. Errors and discards cannot be analysed, as no traffic is recorded for an error or discard.
Assuming that at least one threshold has fired over the previous minute, in the set of interfaces and the threshold type you select, the root cause factors will be shown in the pie chart on the left. If you hover the mouse over a pie section, more detail about that factor will be shown, including the percentage of flows that the factor was present in, on all interfaces with a threshold violation. This helps you determine if a factor was a major contributor to the threshold violation, or if it was just one of many. If you then click on a pie section, the right-hand bar chart will be updated to show the percentage of flows that this factor was seen in, broken out by interface with a threshold violation. Only the top ten interfaces are shown. The colour of the bar represents the state of the threshold on that interface. If you click on a bar in the right-hand chart, then sFlowTrend-Pro will take you to the traffic chart for that interface, showing the top flows filtered by the root cause factor. Use this to get a full picture of the traffic that is causing the threshold violation on a specific interface.
The root cause analysis updates every minute, as new traffic is analysed. You can freeze the update to allow a more detailed analysis on the existing data by clicking the button. The text of the button will change to indicate the time that update was frozen at. To resume normal minute updates, and ensure that you are analysing the latest data, click the button again.