
Application Performance
Traffic Sentinel provides a number tools for analyzing application performance.
Setting up application monitoring
There are a few configuration steps needed before Traffic Sentinel can be used to monitor application performance.
1. Host sFlow
Traffic Sentinel relies on hosts to export performance statistics using sFlow. Hosts must be configured to send sFlow to the Traffic Sentinel server on UDP port 6343.
Note: A free, open source, sFlow agent can be downloaded from sflow.net.
2. Application sFlow
Traffic Sentinel relies on application software to export performance statistics using sFlow. Typically the applications automatically pick up their settings from the Host sFlow agent and don't require additional configuration. A list of applications that currently support sFlow monitoring is available at sflow.net/relatedlinks.php.
3. Configure Zones and Groups
Collecting host sFlow agents into Zones and Groups helps navigate large numbers of hosts and allows performance metrics to be rolled up by Group and Zone (see Configuring Traffic Sentinel).
4. Configure Thresholds
Setting thresholds on host performance metrics generates alerts when hosts become overloaded and helps highlight abnormal values that need attention (see Configuring Traffic Sentinel).
Monitoring Applications
Traffic Sentinel has four tabs under the Services menu providing different views on the application performance statistics.
1. Services>Status
The Services>Status page shows the status of the applications, and the server resources they depend on, throughout the data center.

Clicking on squares in the grid will drill-down to show more details about the status. The Status, CPU, Memory and IO columns are associated with Host metrics and link to the Hosts>Statistics page. The Operations and Errors columns are associated with Services metrics and link to the Services>Statistics page.
Clicking on row labels expands detail for the selected group of servers. At any level in the hierarchy you can click on the Explore button to report application statistics for the selected group of servers (see Reporting). Clicking on the Hosts button shows the host resources available to the applications (see Host Performance). At any time you can click on the Services>Statistics, Services>Trend and Services>Top N tabs to examine the performance metrics for the selected servers.
Drilling down to the agents shows the IP addresses and domain names of each agent reporting application statistics.
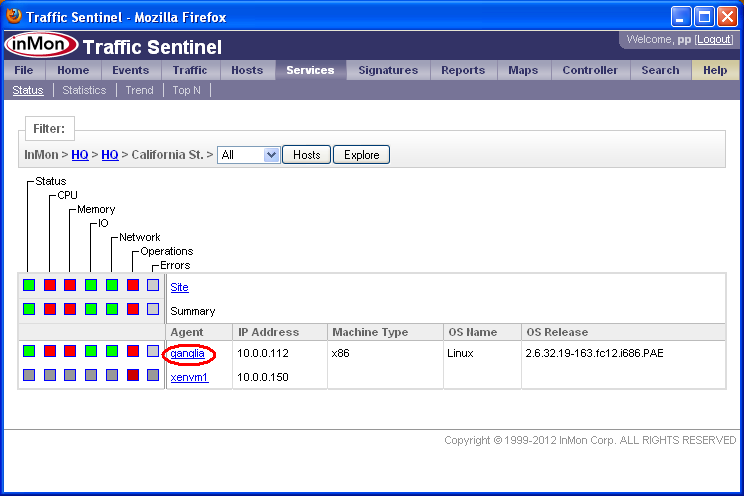
Clicking on an agent shows the application instances being reported by the agent.
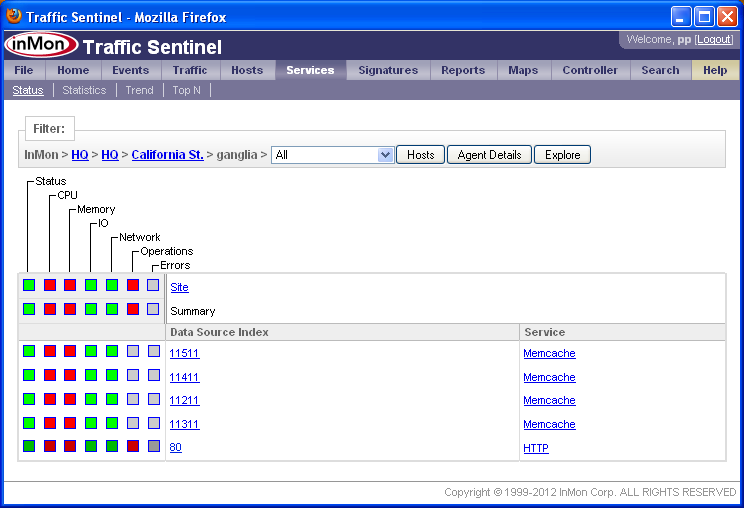
In this case the agent ganglia is reporting on four Memcache instances and an HTTP instance. Each application instance is identifed by a Data Source Index, typically the network port that the application uses to receive network requests. In this example the four Memcache instances are listening on ports 11211, 11311, 11411 and 11511 and the HTTP instance is listening on port 80.
2. Services>Statistics
The Services>Statistics table shows the performance of a selected Service running on servers in the current Filter: path, sorted by a selected metric:
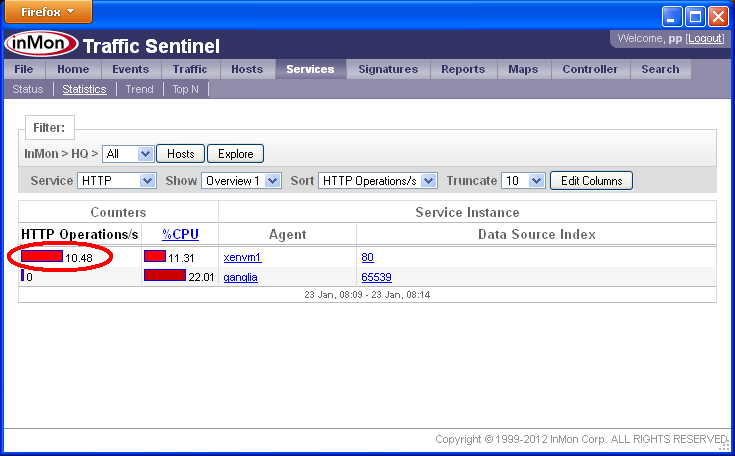
In this case, the table shows metrics for the HTTP service. Each row in the table represents a single application instance. Clicking on a column label sorts the table by that metric. Clicking on a bar in the table drills down to show a Services>Trend view of the statistics for the application instance.
Note: You can mix Host metrics with Service metrics in the Statistics table. Clicking on a bar associated with a Host metric will go to the Hosts>Trend page.
3. Services>Trend
The Services>Trend page displays a set of trend charts characterising the performance of a selected Service running on servers in the current Filter: path.
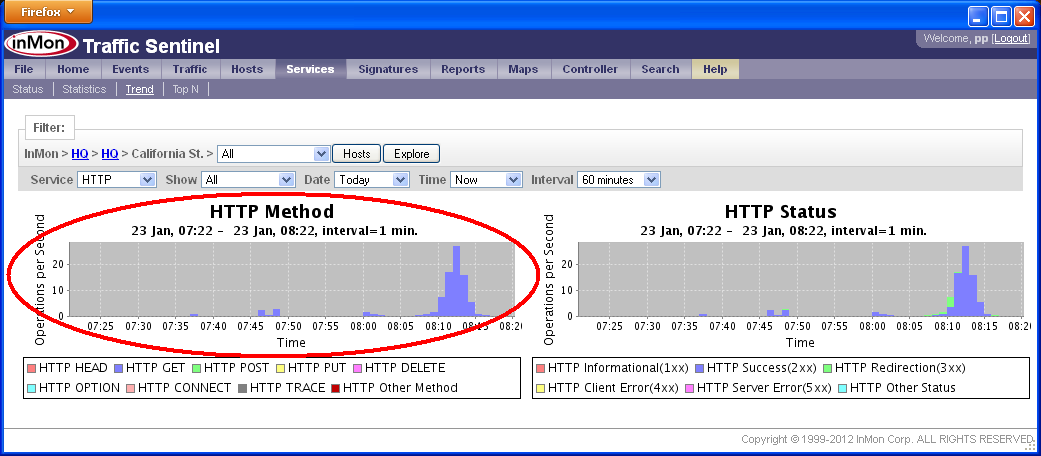
In this case the charts trend performance of the HTTP service. When the Show: setting is set to All the statistics represent a rollup up summary of the performance of all the servers in the path.
Click on a chart to break out the members of the group by the selected metric.
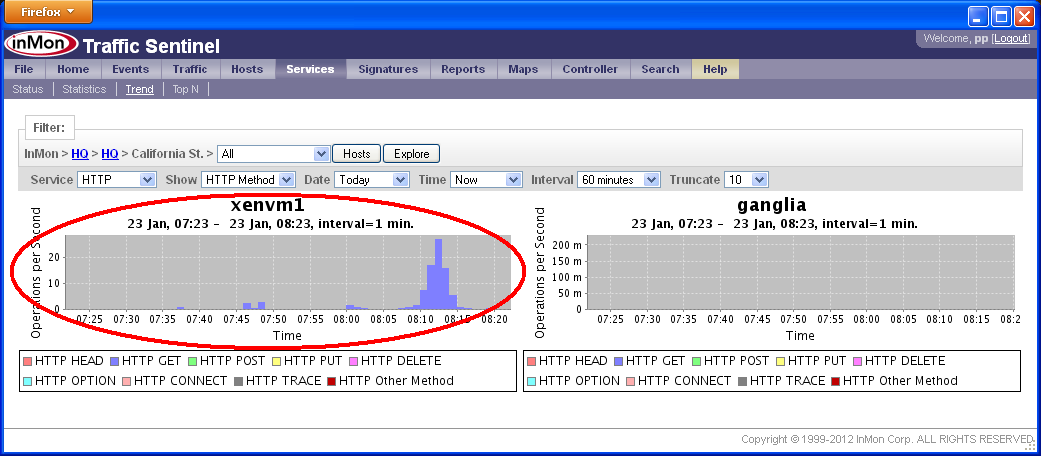
In this case, the HTTP Method chart for each of the agents in the California St. group is shown.
Clicking on a chart drills down further. In this case clicking on the xenvm1 chart would show details of the HTTP instances running on the server.
4. Services>Top N
The Services>Top N chart shows detailed information about the transactions being processed by a selected Service running on servers in the current Filter: path.
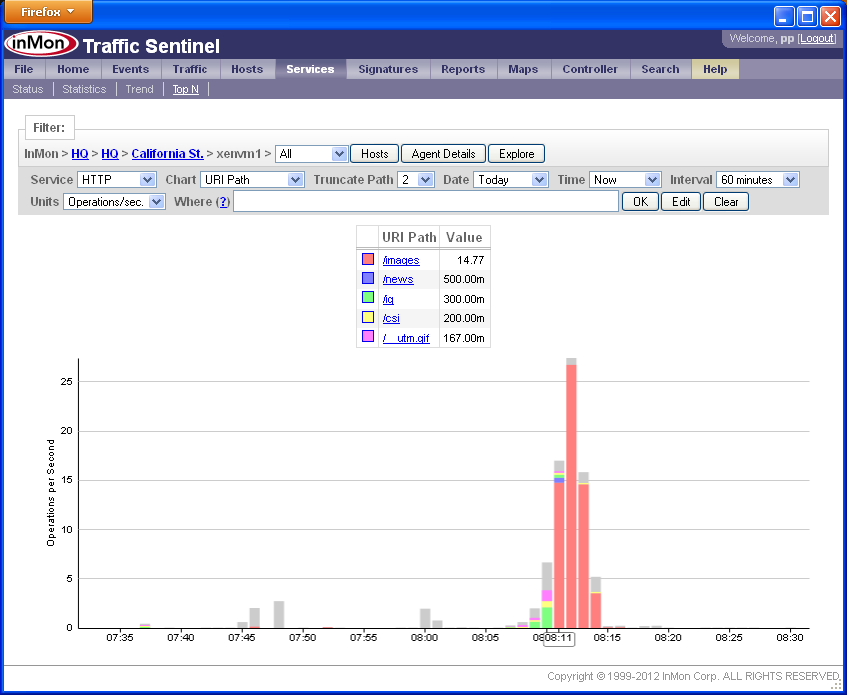
In this case the chart shows Operations per Second for the HTTP service broken out by URI Path. Clicking on bars in the chart shifts focus to the selected time period and shows the top contributors in that interval. Clicking on links in the legend allows the data to be filtered to Include or Exclude the selected item.
Note: The Truncate Path setting is used to roll up the data in order to best see patterns. In this case displaying on the first two tokens of each URI Path so that is is clear that most requests are for objects in the /images path.
Reporting
The Reports>Explore page can display long term performance statistics for a service.
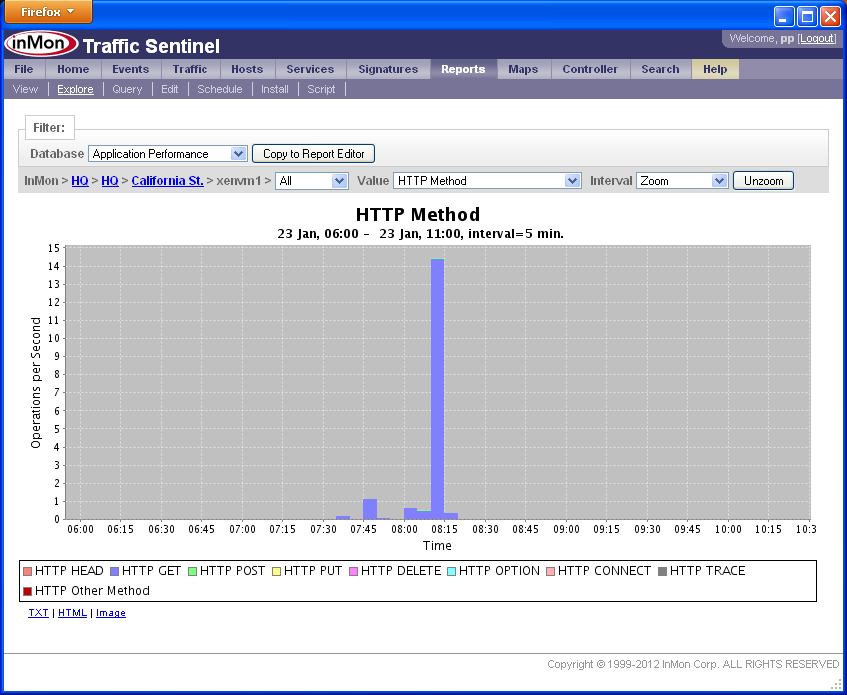
Selecting Application Performance as the Database reports on application performance counters. In this case, trending HTTP operation counters.
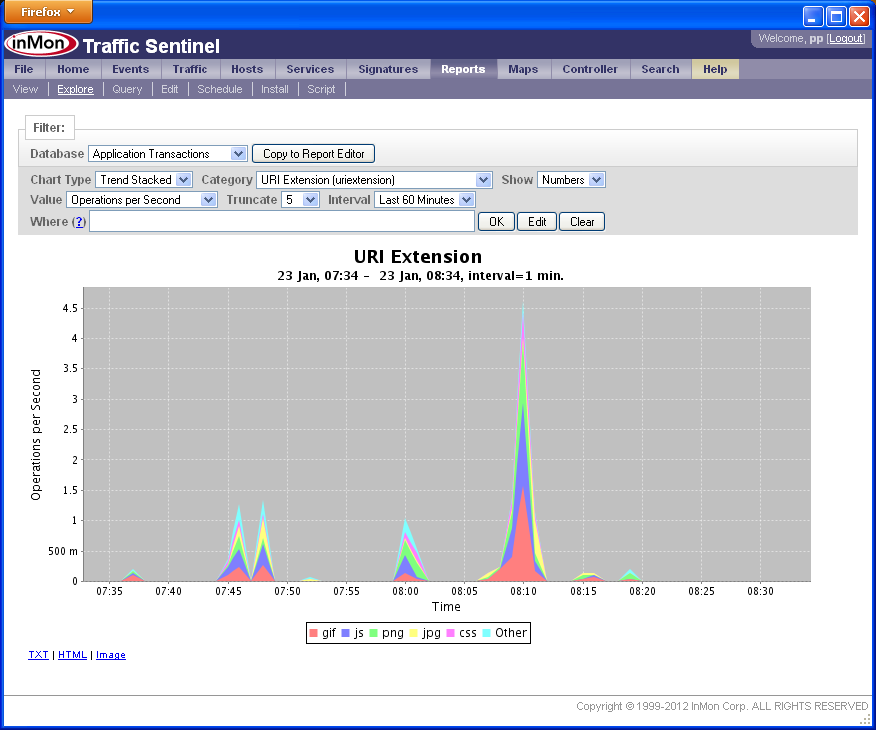
Selecting Application Transactions as the Database reports on application transaction attributes. In this case, showing operations broken out by URI Extension.
Host Performance
Application performance depends on the performance of the underlying compute infrastructure. Clicking on the Hosts button in the Filter: bar switches to the Hosts monitoring tab and selects the current path to show performance of the servers hosting the service. For example, the Services>Top N chart might show an increase in response time. Clicking on the Hosts button will reveal if the problem is due to overloaded servers, excessive swapping etc.
Traffic
Application performance also depends on the performance of the underlying network infrastructure. Use Drill-down traffic analysis to examine network performance. For example, a decrease in the performance of a Memcache cluster may be due to packet discards in the network.
| Related Topics |
|