
| For More Information |
|
Traffic Sentinel
Scaleable network intelligence
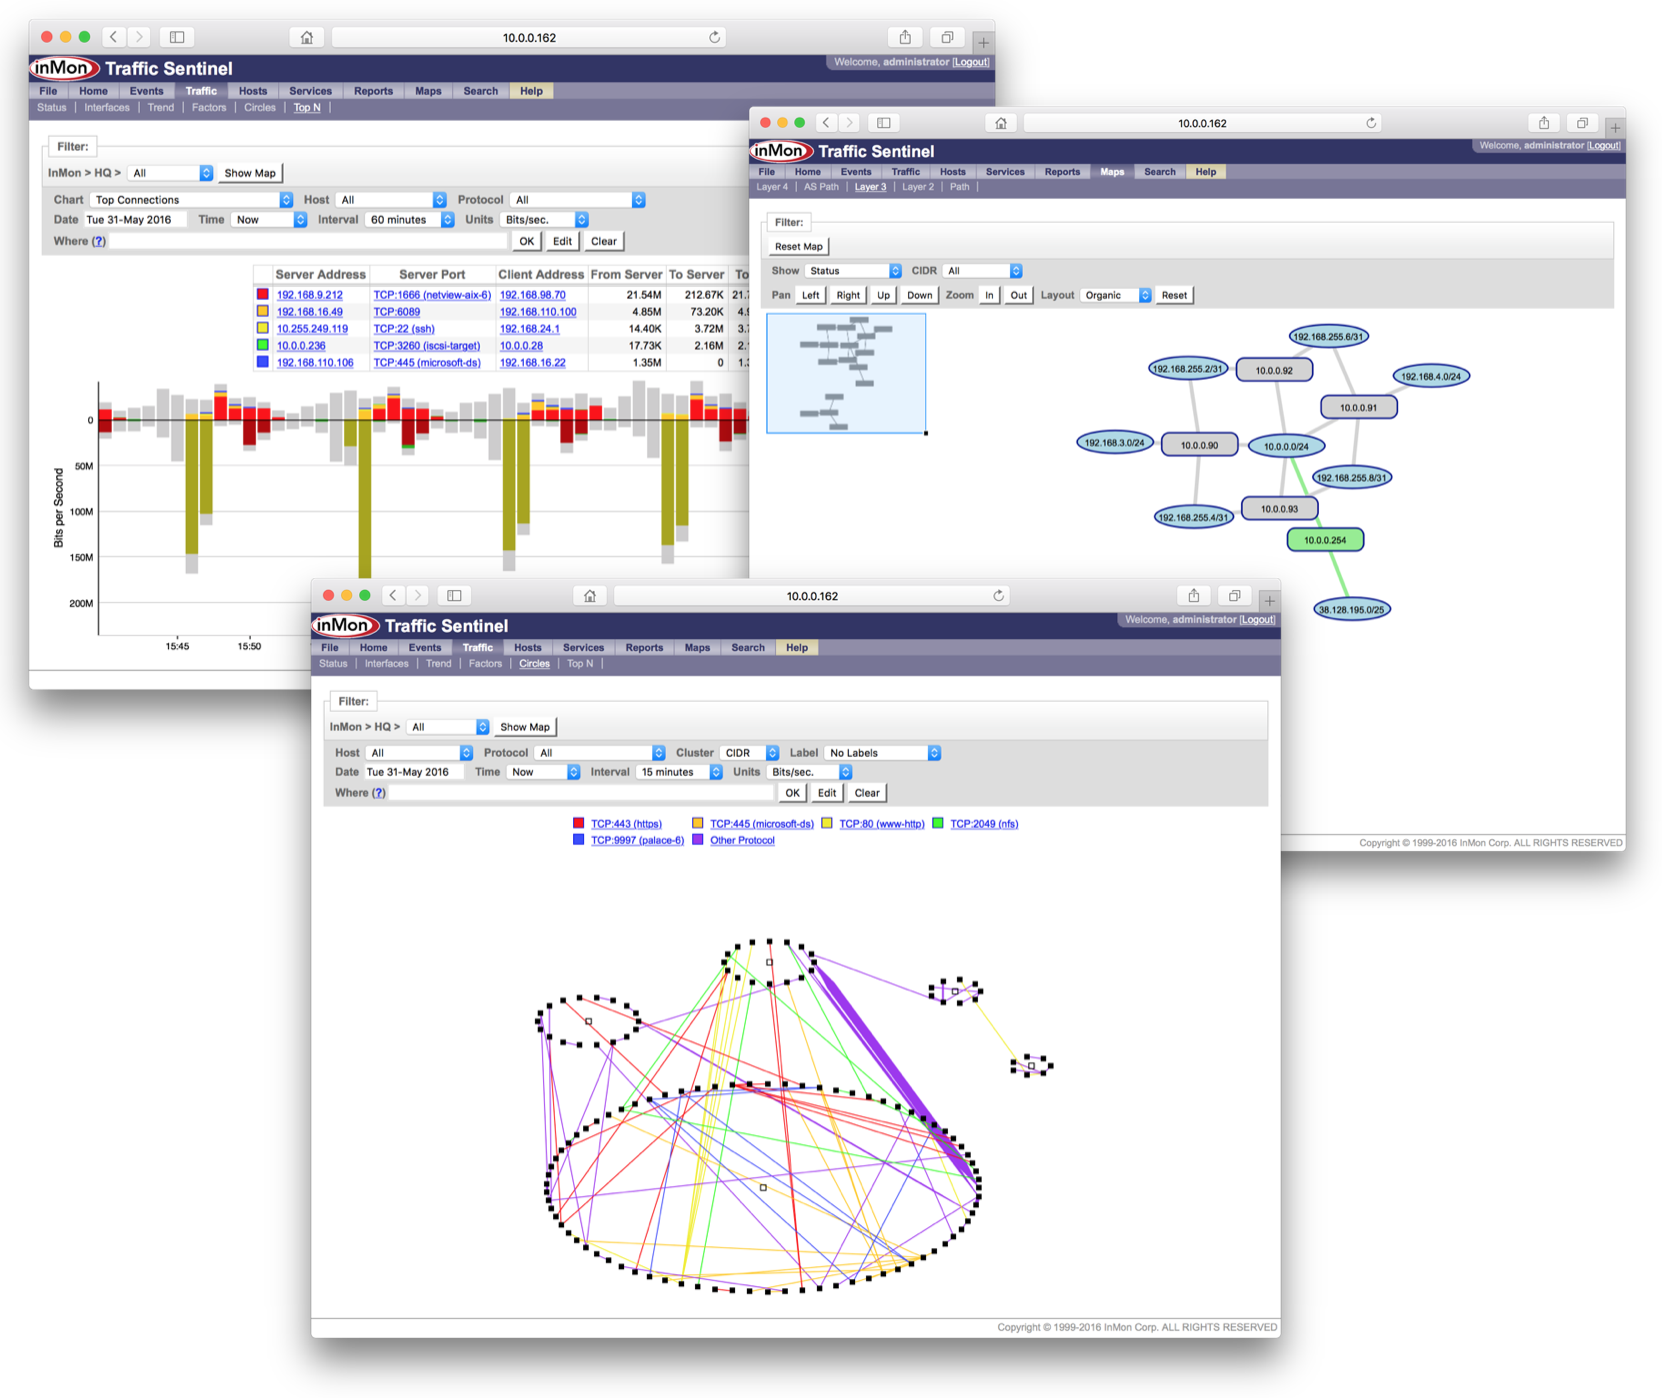
Traffic Sentinel™ provides real-time network visibility to manage large complex networks. An intuitive drill-down interface simplifies navigation through detailed network data to quickly find answers.
- Understand who is using the network, where they are, and what they are doing.
- Rapidly identify the cause of any problems or abnormal traffic.
- Understand trends in usage and accurately target upgrades.
- Generate reports on current and historical performance.
Traffic Sentinel has at its core InMon's patented correlation engine and database that is capable of continuously monitoring tens of thousands of switch/router ports. Sophisticated statistical algorithms combine peformance data from all the devices to build an easily queryable real-time picture of the entire network (U.S. Patents 8005009, 8427950, 8838774).
Key features
Traffic Sentinel makes use of embedded instrumentation within switches, routers, load balancers, and servers. Industry standard sFlow provides the richest information, greatest scalability, and is supported by the largest number of vendors (see sFlow Capable Devices). Traffic Sentinel also accepts IPFIX and a number of proprietary monitoring technologies, including: Cisco NetFlow, Juniper J-Flow, and HP Extended RMON. The use of embedded switch and router monitoring eliminates the need for probes, is simple to deploy, cost effective, and provides detailed network-wide visibility.
- Network-wide thresholds and alarms
- Real-time top n visualization
- Host location
- Automated L2 and L3 topology discovery and mapping
- Application dependency mapping
- Fullly detailed historical data retention
- Customizable interactive and scheduled reporting
- Continuous monitoring of tens of thousands of switch ports and servers
- Access to performance data from any web browser or web-aware application
- Easy integration with other applications through open interface and web-based queries
Technical Specifications
| Protocols Monitored Full layer 2 - layer 7 analysis: Ethernet/802.3/SNAP/MPLS/TRILL/SPB/QinQ FCoE, iSCSI, NFS, CIFS IPv4/IPv6/ICMP/UDP/TCP VxLAN/Geneve/GRE BGP4 source, destination, peer, full AS path analysis Server performance: Physical server CPU, memory, disk and network IO Virtual machine CPU, memory, disk and network IO Server UUID, OS, machine type and MAC addresses Application performance: HTTP URL, Referer, operation, mime-type response time, status code, bytes, requests Standard reports Traffic profiling and trending (host, protocol, link) Server profiling and trending (CPU, memory, disk, network) Cluster performance Top servers IP multicast sources, channels and trends BGP AS Path analysis Usage accounting Unauthorized activity Data Sources sFlow (including host, ADC, and web server extensions) IPFIX (over UDP) Cisco NetFlow Versions 1, 5, 7 and 9 (non-aggregated) Juniper j-flow (non-aggregated) SNMP (1, 2c, 3) Monitors 100,000+ switch ports from a single server |
System Requirements Traffic Sentinel is a web-based application that runs on a variety of platforms designed to monitor different size networks. Virtual Machine Medium size network (campus, small data center)
Stand-alone server
| ||||||||||||||||||||
| |||||||||||||||||||||