Table of Contents
- 9.1. Managing all reports
-
- 9.1.1. Organizing report definitions

-
- 9.1.1.1.
 Adding a folder
- 9.1.1.2.
 Adding a report definition
- 9.1.1.3.
 Copying a report definition
- 9.1.1.4.
 Adding a report section
- 9.1.1.5.
 Copying a report section
- 9.1.1.6.
 Deleting a folder, report definition or report section
- 9.1.1.7. Importing and exporting report definitions
- 9.1.1.8.
 Reloading report definitions
- 9.1.1.9. Changing the name of a folder, report definition or report section
- 9.1.1.10. Reorganizing reports and sections using drag and drop
- 9.1.1.1.
- 9.1.2. Editing report definitions
- 9.1.3. Scheduling a report
- 9.1.4. Viewing report results
- 9.1.5. Editing a query section
- 9.1.6. Editing an HTML section
- 9.1.7. Running a report
- 9.1.1. Organizing report definitions
- 9.2. Managing scheduled reports
The Reports tab allows you to define custom reports, run reports (manually or automatically on a defined schedule), and view and save the results of running a report.
A report definition consists of a description to describe the purpose of the report, an optional schedule to run the report automatically, and a number of report sections. There are two types of report section:
- Query section
- A query section is used to define a query that will extract data from the sFlowTrend-Pro database and display results in tabular or graphical formats.
- HTML section
- An HTML section is used to embed text and other material in a report. For example an HTML section can be used to add a title and description for the data shown in a query section.
Running a report definition produces report results. These results can be saved so that they are available later and accessible to other users.
The Reports tab includes two sub-tabs:
- Reports
- Hierarchical view of all reports and their sections and settings. This sub-tab allows you to manage all your reports, for example, create new reports, edit and delete existing reports, and organize reports in folders. It also allows you to view the results of reports that have been run.
- Scheduled reports
- Sortable table of reports that have been scheduled to run automatically. This table includes information about the current status and perfromance of scheduled reports. It also allows you to cancel a scheduled report that is running.
The Reports sub-tab includes a reports browse pane that allows you to view existing report definitions, create and delete report definitions, and add and delete sections to report definitions.
When you first install sFlowTrend-Pro a number of example report definitions will be installed in the System reports folder.
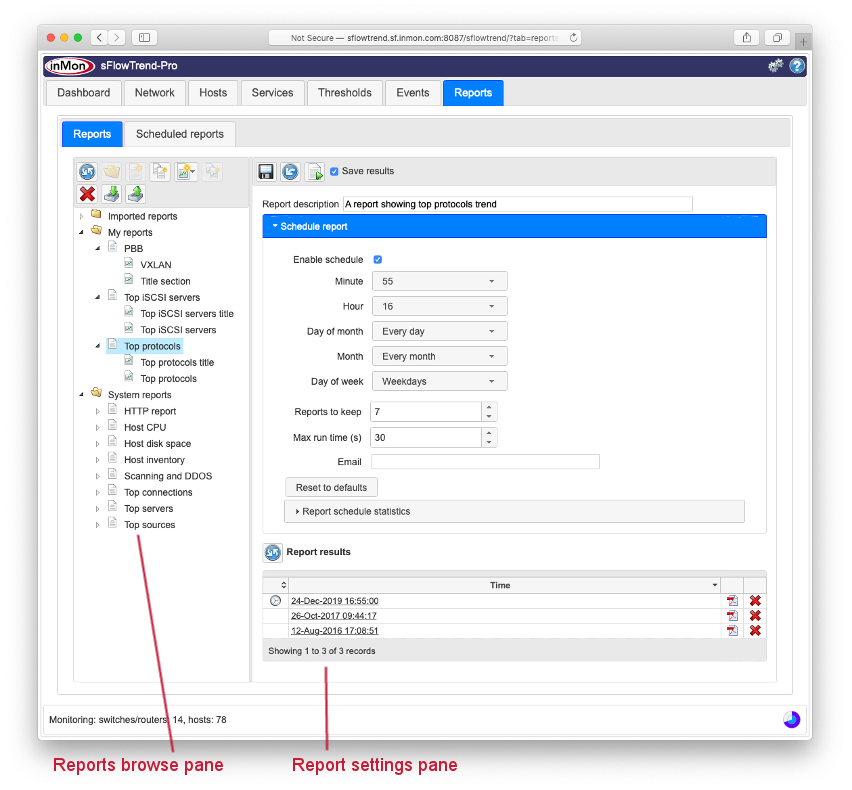
The Reports sub-tab also includes a report settings pane that allows you to change the settings for a report and its sections. It also includes a number of controls:
-
 Allows you to save any changes to the settings.
This control is only active if you are an administrator and
you have changed the settings.
Allows you to save any changes to the settings.
This control is only active if you are an administrator and
you have changed the settings.
-
 Allows you to undo any changes to the settings since the last
save. This control is only active if you have changed
the settings.
Allows you to undo any changes to the settings since the last
save. This control is only active if you have changed
the settings.
-
 Allows you to run the report definition, including
all the sections with the current (possibly unsaved) settings.
The resulting report will be opened in a new window.
Optionally if you are an administrator, you can save the
results, by checking the Save results
checkbox before you run the report definition,
so that the results are available later and accessible to
other users.
Allows you to run the report definition, including
all the sections with the current (possibly unsaved) settings.
The resulting report will be opened in a new window.
Optionally if you are an administrator, you can save the
results, by checking the Save results
checkbox before you run the report definition,
so that the results are available later and accessible to
other users.
The reports browse pane allows you create, edit, and delete report definitions. It also allows you to organize report definitions in folders. Folders, report definitions and report sections are shown using icons:
-

 Open or closed folder. Folders are always shown sorted
alphabetically.
Open or closed folder. Folders are always shown sorted
alphabetically.
-
 Report definition. Report definitions are always shown
sorted alphabetically within a folder.
Report definition. Report definitions are always shown
sorted alphabetically within a folder.
-
 Report section
The reports browse pane includes a tool bar with a number of buttons which allow you to create and organize report definitions. It also allows you to rearrange report definitions using drag and drop. You can access common tasks by clicking with the button and selecting from the menu.
To add a new folder in an existing parent folder, first select the
parent folder and then click the new folder
button. To add a new folder at the top level, make sure that there
is no selection in the reports browse pane,
and then click the new folder button. The new folder button will
be active only when a folder is selected or there is no selection.
To add a new report definition, first select the folder which will
contain the new report definition, then click the new report
button. The new report button will be active only when a
folder is selected.
To copy report definition, first select the report definition
that you want to copy, then click the copy report
button. A copy of the report definition will be created in the
same folder as the original report definition. You can use drag
and drop to move the copied report definition to another
folder.
The copy report button will be active only when a report
definition is selected.
To add a new report section, first select the report definition
in which to add the new section, then click the new section
button, and then select either HTML section,
Query section,
or Scripted query section.
The new section button will be active only when a report
definition is selected.
To copy a report section, first select the report section
that you would like to copy, then click the copy section
button.
A copy of the report section will be created in the same report
definition as the original report section. You can use drag
and drop to move the copied report section to another
report definition.
The copy section button will be active only when a report
definition is selected.
To delete a folder, report definition, or report section, first
select the folder, report definition or report section, then
click the delete
button. The delete button will be active only when there is a
selection. You can also delete the current selection by
clicking with the button and
selecting Delete from the menu.
sFlowTrend-Pro allows you to import report definitions and export report definitions so that they can be imported into another sFlowTrend-Pro installation.
To import a report definition, click on the import button
 .
This brings up a dialog which allows you to select a previously
exported report definition and import it into sFlowTrend-Pro. The
report definition will be imported into the
Imported reports folder in the
Reports tab.
.
This brings up a dialog which allows you to select a previously
exported report definition and import it into sFlowTrend-Pro. The
report definition will be imported into the
Imported reports folder in the
Reports tab.
To export a report definition, first select the report that
you would like to export. Then click on the export button
 .
The definition for the selected report will be downloaded to the
web browser's download location. The exported report definition
can then be transferred to another sFlowTrend-Pro installation or
shared with other users. The export button will be active only
when a report is selected. You can also export a
selected report definition by clicking the
button and selecting
Export.
.
The definition for the selected report will be downloaded to the
web browser's download location. The exported report definition
can then be transferred to another sFlowTrend-Pro installation or
shared with other users. The export button will be active only
when a report is selected. You can also export a
selected report definition by clicking the
button and selecting
Export.
Administrators can make changes to report definitions and how they
are organized. To load changes that other administrative users have
made click on the reload reports
button.
You can change the name of a folder, report definition, or report section by clicking on the folder, report definition or report section. Or you can click with the button on the current selection and select Edit name from the menu. You will be allowed to rename a folder, report definition or report section if you choose a name which is unique among siblings.
When you change the name of a folder, the folders in the parent folder will be resorted alphabetically. Similarly, when you change the name of a report definition, the reports within the folder will be resorted alphabetically.
The reports browse pane supports drag and drop. You can use drag and drop to move a folder to a different folder, move a report definition to a different folder, reorder sections within a report, or move a section to a different report. You will be allowed to move a folder, report definition or report section only if the move will not duplicate a name.
When you select a report definition or section in the
reports browse pane, you can then edit its
settings in the report settings pane.
You can edit the description for the report definition,
define a schedule to run the report automatically
(see Section 9.1.3, “Scheduling a report ”), and view
saved report results (see Section 9.1.4, “Viewing report results”).
![[Note]](images/note.png) |
Note |
|---|---|
|
The report description describes the purpose of the report. This description is not shown in the report results. To add a description to a report result you can add an HTML section to the report. |
When you select a report definition in the reports browse pane, the reports settings pane includes an expandable section, Schedule report, which allows you to configure a report to run automatically on a schedule.
To define a schedule for a report, first select
Enable schedule. This will then activate
all the report schedule configuration fields. sFlowTrend-Pro uses
a cron expression to define a schedule. A cron
expression for the schedule comprises five fields
(Minute, Hour,
Day of month, Month,
Day of week) each of which
can be set with a selector. The selectors allow you to select
the most commonly used options, or to select
Advanced for more complex expressions.
When you select Advanced for a field,
a text input field will be displayed and you can use this to
enter a custom string for that field.
For example, to schedule a report to be run at 16:55, on weekdays, every month, set the selectors as shown in the screenshot at Section 9.1, “Managing all reports”.
Deselecting Enable schedule disables the report from being run on a schedule, but retains the configured schedule settings.
In addition, specifying a schedule on which to run a report, you can also configure the following settings:
- Reports to keep
- Number of scheduled report results to keep. The oldest results of running a report are deleted to ensure that no more than the specified number of results are kept. Report results that were generated by running a report manually are not affected by this setting.
- Max run time (s)
- The maximum time the scheduled report should be allowed to run (in seconds). If the scheduled report exceeds this time, it will be cancelled automatically.
- Email address to send report results to after the report has been run on the schedule. You can specify a number of email recipients by entering a comma separated list of email addresses. For this setting to work you must first configure sFlowTrend-Pro with the email SMTP server (see Section 13.2.5, “Email”).
The Reset to defaults button stops the report from running on a configured schedule and removes the schedule settings.
After you have made changes to the schedule settings, you must
click the save button
.
The Schedule report section also includes an expandable section Report schedule statistics which indicates when the the report was last run and how long it took to run (on the currently configured schedule), and the current scheduled state.
When you select a report definition, the reports settings pane includes a table of saved report results. Each row in the report results table shows the time at which the report results were generated and also the following columns:
-
 Indicates that the report result was generated when
the report was run automatically as defined by the
schedule.
Indicates that the report result was generated when
the report was run automatically as defined by the
schedule.
-
 View the report results in PDF format.
-
delete the report results.
To refresh the report results table to load report results that have been generated by other users click the
under the report results table.
When you select a query section in the reports browse pane, the report settings pane will display the settings for the query section. In a query section you can define a query to specify the data that you want to extract from the database, and a display format for the data that is produced when the query is run.
A query specifies the data that you want to extract from the
database. When a query is run it produces a table of results.
When you define a query you are specifying the columns or
fields that should be present in the table.
A column can be a key field, for example
sourceAddress, or a
value field, for example
bytesTotal.
Each row in the table will represent a unique combination
of the keys and values associated with that combination. For
example, if a query is defined to have the fields
sourceAddress and
bytesTotal, then the query will produce a
table of data where each row in the table includes a unique
source address and the bytes sent by that address.
sFlowTrend-Pro supports commonly used, basic queries defined using Basic settings (see Section 9.1.5.2, “Editing a query using basic settings”), flexible, complex queries using Advanced settings (see Section 9.1.5.3, “Editing a query using advanced settings”), and flexible, complex queries with the ability to further process the results before display using Scripted settings (see Section 9.1.5.4, “Editing a query using scripted settings”).
When you add a new query section, a default query section will be created with Basic settings. You can edit these settings in the Basic settings tab, or if you are defining a more complex query, you can view the basic settings in the Advanced settings tab or the Scripted settings tab, and then edit the settings in one of these tabs. However, if you edit the settings in the Advanced settings tab, the settings will become incompatible with the Basic settings, so you will only be able to view and edit the query settings in the Advanced settings tab and Scripted settings tab. Similarly, if you edit the settings in the Scripted settings tab, the settings will become incompatible with the Basic settings and Advanced settings so you will only be able to view and edit the query settings in the Scripted settings tab.
The table of data produced when a query is run can be displayed in a number of different formats. You can select the most appropriate format for your use of the data. Displaying the data in a Table gives the raw data from the query; use this if you need the actual numbers. For example, you might want to check on the absolute utilization of a link, or use the data in another application. Displaying the data in a Chart helps visualization of the results; use this if you want to compare different items quickly, for example, easily see the largest contributors to the utilization of a link. Another important difference between using a table and a chart is that a chart must have a value to plot. A table does not require a value, and so can be used to answer questions such as "which addresses were seen on a specific interface?".
In addition to choosing between a table and a chart, you can also decide whether to view the data as a total over the entire time period selected for the query, or as a trend of data over time. If you view the data as a total, then rows in the table represent data points for the whole time period. In this case, the interval from the time selector is ignored. If, however, you want to understand how a value changes over time, then you should select a trend. With a trend, each row in the table represents a data point for a period of time defined by the time selector interval.
If we use the Top Sources by frames query as an example, displaying the result of this query as a total will give the total frames sent by each of the top sources over the time period. Displaying the result as a trend will show how the number of frames sent by each of the top sources changed over time.
When a chart is used to display query results, the chart interprets results data using series, categories and values. sFlowTrend-Pro will choose the most appropriate fields to plot as categories and series based on the type of chart selected.
- Categories
-
Categories are plotted on the x-axis of a chart. Charts that show data as totals have explicit categories, defined from the key fields that were used in the query. The categories are generated from all the unique combinations of the key fields found in the data. For example, if the key fields were
sourceAddressanddestinationAddress, then there will be a category for source-destination pair found in the data.Charts that show data as a trend over time use time as categories. Each category corresponds to an interval in the overall time period of the query.
- Values
-
Values are plotted on the y-axis of a chart. The value fields in the results form the values for the chart. Each category will a plotted against each of the values.
- Series
-
Each series contains a set of related data. How a series is plotted depends on the type of chart. For example, a bar chart will show each series as a set of bars of the same color, and each category will have a bar of each color. A stacked bar chart shows only one bar per category, but each bar will contain several segments, with each segment representing a series.
For charts that show data as totals, a series is generated for each value field in the results. For example, if the value fields were
framesTotalandbytesTotal, then one series is created for frames, and one for bytes. Recall that for a totals chart the categories are created from the key fields; this means that each series is formed from the associated value field plotted against each category.For charts that show data as a trend, the series are generated from the key fields in the results. This is done in a similar way to the categories in a totals chart: each series will consist of the unique combinations of the key fields found in the results data. For example, if the key fields consisted of
sourceAddress, then a series would be created for each source address found in the results. These series are then plotted against time.
The display format information panel (see Section 9.1.5.2, “Editing a query using basic settings”) is useful in understanding how a query will be plotted. When a query is created in the basic or advanced settings tabs, then the categories, series and values that will be produced are shown. For time trend charts, since the categories are always time, this is assumed and not shown in the information panel. Similarly, for a totals chart, since the series are always generated from the values, the series are not shown. In the case of a table, the columns that will form the table are shown.
The following formats can be used to display the data:
- Bar chart (totals)
-
Displays the data in a bar chart, with bars used to show the values for each series in the data. Bar charts are used to display and compare data summarized over the query time period.
If one series is available (in the query one value is selected), then a single bar per category is shown. If multiple series are present, then a group of bars is plotted for each category, with the bars colored to indicate the series.
- Stacked bar chart (totals)
-
Displays the data in a stacked bar chart. This is similar to a normal bar chart, and when only one value field is selected in the query, produces the same result. However if multiple values are selected in the query, a series is generated for each value, and instead of plotting a separate bar for each series, a stacked bar is used. Each segment of the stacked bar represents a different series.
This type of chart is useful when two similar values are to be compared, for example
framesInandframesOutfor an interface. - Line chart (trend)
-
Displays the data in a line chart trended over time. Each series in the data will be shown as a separate line in the chart, plotted against the categories. Use this chart to see how data changes over time.
A line in the chart is plotted for each series. With advanced charts, if more than one value is selected, a separate chart will be created for each value.
- Area chart (trend)
-
Displays the data in an area chart trended over time. Each series in the data will be shown as an area in the chart. The areas for each item will overlap, which can make the results of this chart difficult to see. You could try a line chart or stacked area chart if this is the case.
As with the line chart, each area in the chart is formed from the series, and a separate chart will be created if multiple values are specified.
- Stacked area chart (trend)
-
The stacked area chart is identical to the area chart, except the areas are stacked on top of each other, rather than overlapping. This can make the chart much easier to read.
- Table
-
Use a table to view the raw results of your query. The table will include a column for each field specified in the query. It is not necessary for the query to include value fields, so a table is useful for inventory reports, where you want to understand what is present, rather than how much traffic is being generated.
All the columns for the query will be displayed in the table.
- Table (trend)
-
The trend table also displays data in a tabular form, but includes time as the first column. Use this type of table to get the specific values from a query, instead of the visualization provided by charts.
All the columns for the query will be displayed. Each row in the table will include the time, and associated data for that time. If there are multiple data points per time period, then there will be multiple rows with the same time. Also, if there are any data points which are the 'other' from a top-n query, then they will be shown with the non-value columns blank (the columns for value fields will show the value for 'other').
The Basic settings tab helps you define and parameterize commonly used queries. These queries are very similar to those used in the Network tab (see Chapter 4, Network), Hosts tab (see Chapter 5, Hosts), and Services tab (see Chapter 6, Services).
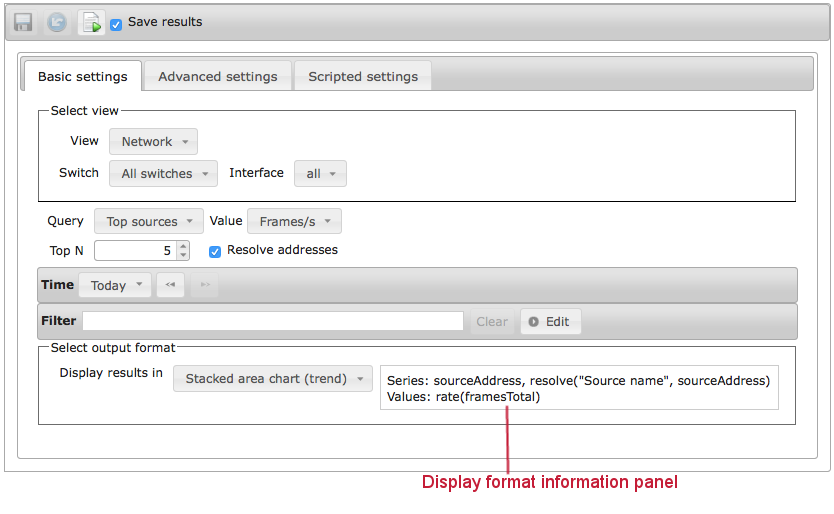
To define a query using Basic settings, first decide whether you are interested in network traffic data (use the View selector to select Network), host performance data (use the View selector to select Host), or service performance data (use the View selector to select Service).
If the query is focused on network traffic data, you can select whether the query should extract data for the whole network or for an individual switch or interface. If the query should extract data for the whole network, use the Switch selector to select All switches. In this case, even if a traffic flow crossed multiple switches, the flow will only be counted once - ie the query de-duplicates the data. If the query should extract data about traffic crossing an individual switch and/or interface, use the Switch and Interface selectors to select the switch and interface of interest.
If the query is focused on host performance, you can select whether the query should extract data for all hosts or an individual host using the Host selector.
If the query is focused on service performance, you can select whether the query should extract data about all hosts or an individual host using the Host selector. You can use the Service selector to select the service of interest.
The next step is to use the Query selector to choose a predefined query; you can think of this as selecting the key fields for the columns in the query results. You can then use the Value selector to specify the value field column for the results. Note that the network Utilization and Counters predefined queries are only available when a single interface is selected using the Switch view and Interface view selectors.
The next step is to parameterize the query:
- Top N
- Specify how many rows there will be in the table. In general only a few contributors are responsible for the majority of the traffic or application transactions. Selecting a value for the top n results in data showing who those few contributors are. The Top N selector is not enabled when network Counters, or Utilization queries, host predefined queries, or service counters predefined queries are selected.
- Time
-
Select the time period for which the query will
extract data. The time selector is described at
Chapter 10, Selecting a time period
 .
.
- Filter
- Further refine the query by filtering on specific attributes of the traffic. Filtering is described at Chapter 11, Filtering.
Once you have fully parameterized the query, you can select how you would like the results to be displayed using the Display results in selector to select a display format. When you select a display format, sFlowTrend-Pro helps you understand how the data produced by the query will be displayed. For example, if you select Bar chart (totals), the display format information panel will show which fields will be used for the categories (bars) and the value field used to determine the height of the bar.
The Advanced settings tab allows you to define your own queries by manually selecting the key fields and value fields that the query should extract data for.
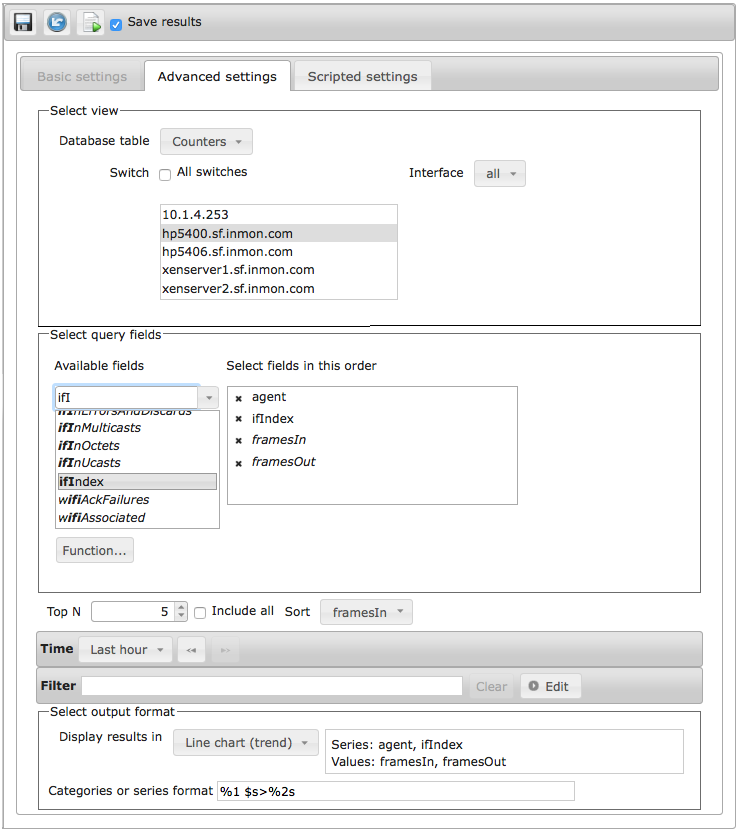
To define a query using Advanced settings, first select the database table that query should access. sFlowTrend-Pro includes three database tables:
- Counters
- This database table includes data on the overall loading of each of the interfaces being monitored.
- Traffic
- This database table includes data on the end hosts using the network and which protocols they are using.
- Host counters
- This database table includes data on the performance of end hosts.
- Service counters
- This database table includes data on the overall application performance.
- Services
- This database table includes data on application transactions and their attributes. It can be used to understand the top contributors to application transaction volume.
If you have selected Counters or Traffic database table, you can then decide whether the query should extract data for the whole network or for specific switches or a specific interface. If the query should extract data for the whole network, check the All switches check box. If the query is to extract data for specific switches, then make sure that the All switches check box is not checked, then select one or multiple switches from the list of switches being monitored. If the query should extract data about traffic crossing an individual interface, select the switch for the interface, then use the Interface selector to select the interface of interest. If the query is defined to have a view with multiple switches, if a traffic flow crossed multiple switches, the flow will only be counted once - ie the query de-duplicates the data.
If you have selected the Host counters database table, you can then decide whether the query should extract data for all hosts or for specific hosts. If the query should extract data for all hosts, check the All hosts check box. If the query is to extract data for specific hosts, then make sure that the All hosts check box is not checked, then select one or multiple hosts from the list of hosts being monitored.
If you have selected the Service counters or Services database table, you can then decide whether the query should extract data for all hosts or for specific hosts. If the query should extract data for all hosts, check the All hosts check box. If the query is to extract data for specific hosts, then make sure that the All hosts check box is not checked, then select one or multiple hosts from the list of hosts being monitored. If the query should extract data about a specific service, then use the Service selector to select the service of interest.
The next step is to specify the fields for which the
query should extract data for. The
Select query fields panel allows you to
select fields from those available for the selected
database. The available fields are shown in the
Available fields list, with the
value fields listed in italic.
If you want to display the results of the query in a chart,
you must select at least one value field.
The Available fields list
includes a type in text field that allows you to filter
the available fields for fields whose names match the
typed in text. For example, if you have selected the
Traffic database, you can type
addr into the type in field to see
only those fields which include
addr in their names.
The Allow nulls in keys checkbox
allows you to specify whether the query results can include
flows with keys whose values are null.
For example if you create a query with
macSource,
ipSource and
framesTotal fields and check
Allow nulls in keys, the query results
can include layer 2 only flows (eg layer 2 broadcasts,
ARP). If you do not check Allow nulls
in keys, then the query results will only include
flows that have both a MAC layer and an IP layer.
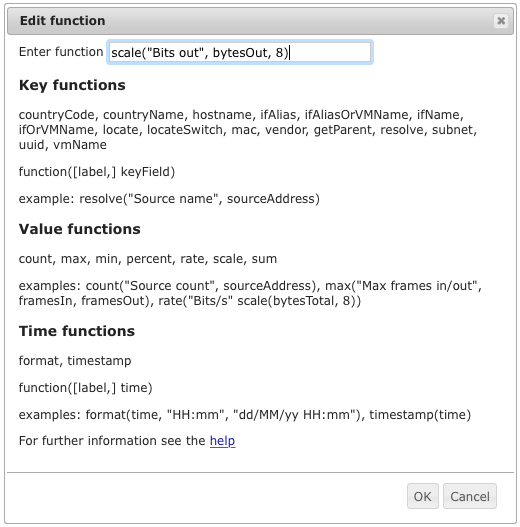
You can also specify functions of fields. Functions are described at Section 16.4, “Database functions”. Click the Function button to show a dialog that helps you build a function. Some functions may not be relevant for the selected database.
If you have selected at least one value field, you will have the option of selecting whether the query results should be sorted and which value the results should be sorted on. You can also specify the Top N, which will cause the query results to show only the top n entries when sorting on the specified value. You can also choose to see all the results by checking the Include all checkbox, this is only sensible if you choose to display the query results in a table.
As with the Basic settings, you can
parameterize the query further by selecting a time period
for which data should be extracted
(see Chapter 10, Selecting a time period ) and a filter to
select traffic that meets certain attributes
(see Chapter 11, Filtering).
The final step is to select the output format for the query results using the Display results in selector. Select a table or chart appropriate to the report you are creating.
The Category or series format field
can be used to improve the formatting of a chart.
This can be set to a string, using the syntax of the Java
Formatter
class. Depending on the chart selected, a list of fields
are used for the categories or series in the chart. The
format string can combine the members of the list into a more
human-readable form. Each item in the list of categories or
series can be referenced in the format string using
%i$s, where i is the
ith
member of the list.
For example, if the series list is agent, ifIndex
(as in the example), and a format string %1$s>%2$s
is used, then the series will be named agent>ifIndex.
If a format is not specified, then the series will be named
using a comma separated list (agent, ifIndex in
the example).
It can be quite complicated to create a format string. The
basic approach is to consider that each item in the
series or category list will always be a string, and can
be referenced using %1$s, %2$s,
etc. Other characters can then be used to combine these
together in a meaningful way (in the example above, the
'>' character is used to separate the
agent from the ifIndex).
The Scripted settings tab allows you to define your own queries by manually specifying the key fields and value fields that the query should extract data for. Using a scripted query allows complete flexibility in the queries that can be run and charts generated. It is also possible to use the same set of data to create multiple output images in the report, for example a chart and a table of results. This technique can make reports faster to run with slow queries, since the query only has to be executed once. Scripted queries are written using the JavaScript language. This document does not describe the JavaScript language, however there are many good books and web sites on this topic. The user contributions area at the InMon Corp customer portal (https://www.myinmon.com) can also be used for sharing example reports with other users.
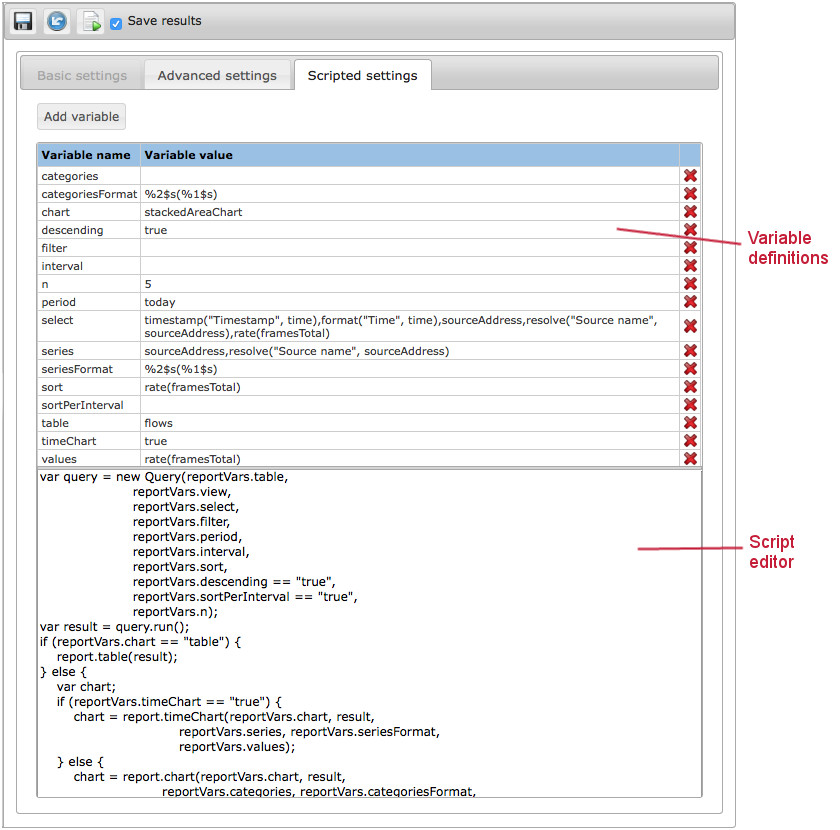
The Scripted settings tab is divided into two areas: variable definitions and the script editor.
Variable definitions allow a query to be parameterized
(run with different settings) without editing the script
itself. Instead, a variable definition is changed.
This mechanism is used by the basic and advanced query
editors to specify the various parameters of a query. If
you view a basic query within the scripted query editor
(by selecting the Scripted settings
tab, you can see the variables used. Variables can be
changed by editing the name of the variable, or the value,
within the table. A variable can be deleted by clicking
,
and new variables added as required. Any variables defined
here can be accessed from the report script as properties
of the reportVars object.
The script editor is how the actual report script is entered. The script should be written in standard JavaScript, which can also include special classes defined by sFlowTrend-Pro. The normal flow of a report is to define the query required, to run the query to obtain a table of results, and finally to visualize the results using a chart or a table. A simple example of top sources is shown below:
var query = new Query("flows", "",
                      'timestamp("Timestamp", time), sourceAddress,\
                       resolve("Source name", sourceAddress), rate(framesTotal)',
                      "", "lastHour", 1, "rate(framesTotal)", true, false, 5);
var result = query.run();
report.timeChart("lineChart", result, "sourceAddress, resolve(sourceAddress)",
                 "%1$s(%2$s", "rate(framesTotal)");
Note that you have to take care with the use of single and
double quotes, and use the line continuation character
\
to concatenate long strings which cover multiple lines
together. In particular, any quotes that appear within
database functions must be double quotes (in the example
above, we have used single quotes for the select string,
to make it easier to then use double quotes within the
functions).
You can refer to Section 16.5, “Classes and objects defined within scripted reports” for the reference of additional objects and classes defined within JavaScript to allow reports to be generated. Section 16.2, “Database fields reference” is the reference of fields available from the database, and Section 16.4, “Database functions” for the database functions that are available.
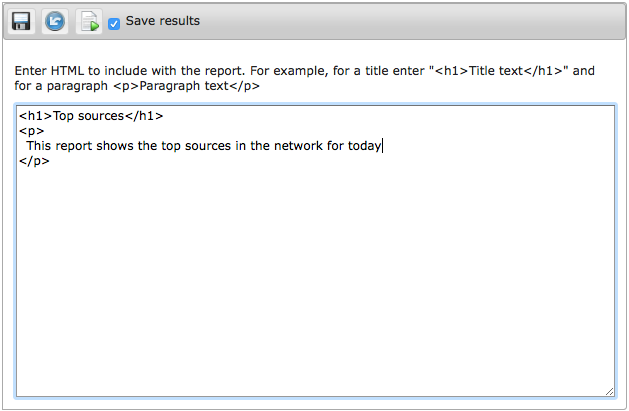
When you select an HTML section in the reports browse pane, the report settings pane will display the settings for the HTML section. An HTML section can be used to provide formatted and unformatted content in the report. For example, if you would like to show a title and a description for a chart produced by a query section, you can insert an HTML section before the query section. You can then edit the settings for the HTML section as follows:
                <h1>Top sources</h1>
                <p>This chart displays top sources for today</p>
You can enter text or HTML formatted text in an HTML section.
To run a report definition, select the report definition or any of
its sections in the reports browse pane, then
click the Run reports button
in the report settings pane. The results
will be displayed in a separate window. If you are an
administrator you can also select to save the results of running
the report by checking the Save results
checkbox . If you have chosen to save results, then
the report results will be available in the report results table
in the report settings pane when the report
definition is selected in the reports browse
pane.
When you run a report definition, the settings that are currently showing will be used and not the saved settings.