The Root cause tab helps you to understand the root cause of traffic on a switch or interface, and optionally the cause of a threshold being tripped.
As with the other network tabs, the first step is to determine which traffic you want to analyze. Start by selecting the switch and interface in the usual way. You can restrict the traffic to just that which has contributed to tripping a threshold by using the Threshold selector, or set this to All traffic to analyze everything, regardless of thresholds.
You can use the Minimum weight selector to remove less important data from the results, to make the table quicker to load and easier to understand. The weight is explained below.
This is an example of the root cause results table:
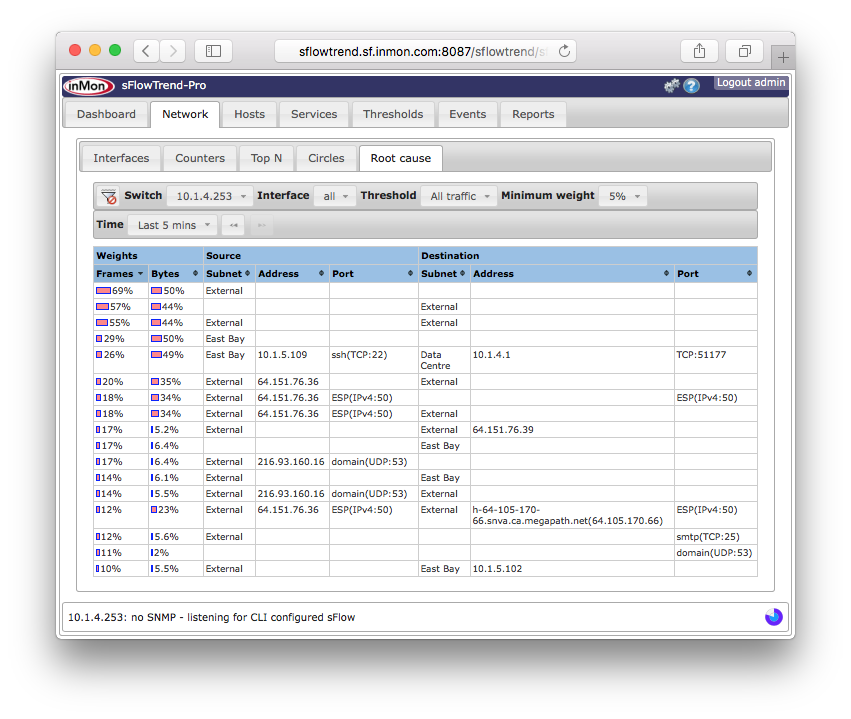
The table is divided into three sections: the Weights of the traffic in the row, details of the Source of the traffic, and details of the Destination of the traffic.
The Weights show the percentage of frames that each row is present in (for the Frames column) and the percentage of bytes of traffic each row is present in (for the Bytes column).
The Source and Destination sections each consists of three columns: Subnet, Address and Port. The meaning of these is:
- Subnet
- If the address falls within a configured subnet, then the name of the subnet will be displayed, otherwise the subnet will be shown as "External". If this entry is blank, it means "any" or "wildcard".
- Address
- The address of the traffic (source or destination, depending on the column). This field will either contain an address, or be blank, signifying "any" or "wildcard".
- Port
- The port of the traffic (source or destination, depending on the column). This field will either contain a port, or be blank, signifying "any" or "wildcard".
Each row in the table shows the percentage of the frames and bytes that the row contributes to. Any blank fields are wildcards (any subnet, address or port).
You can use the data in the table to identify the key contributors to traffic (for a switch or interface, for all traffic or just where a threshold has been tripped, depending on the selectors used). For example, in the screenshot above, we can see that 69% of all frames and 50% of all bytes for the switch displayed are sourced from the External subnet (as all other fields are blank). Similarly, 57% of frames and 44% of bytes are sent to the External subnet. Looking towards the bottom of the table, 12% of frames and 5.6% of bytes are from the External subnet and being sent to TCP port 25. This highlights that the rows are not additive; each row may be a super-set or subset of other rows (the external source to port 25 is a subset of the first row, just external source).
If you click with the mouse button on the frames or bytes entries in a row, you can drill-down to the data specified in that row - a filter will be created using the other fields in the row. This is an easy way to understand the traffic that the row is composed of.