sFlowTrend-Pro raises events when various conditions are detected. Traffic threshold events are raised when traffic levels cross the defined thresholds (see Chapter 7, Using and configuring thresholds). System events are raised when various conditions in the operation of sFlowTrend-Pro are detected (for example when users connect to or disconnect from sFlowTrend-Pro or if an error occurs). Schedule report events are raised when a schedule reports runs. completes, or has an error. You can view these events in the Events tab.
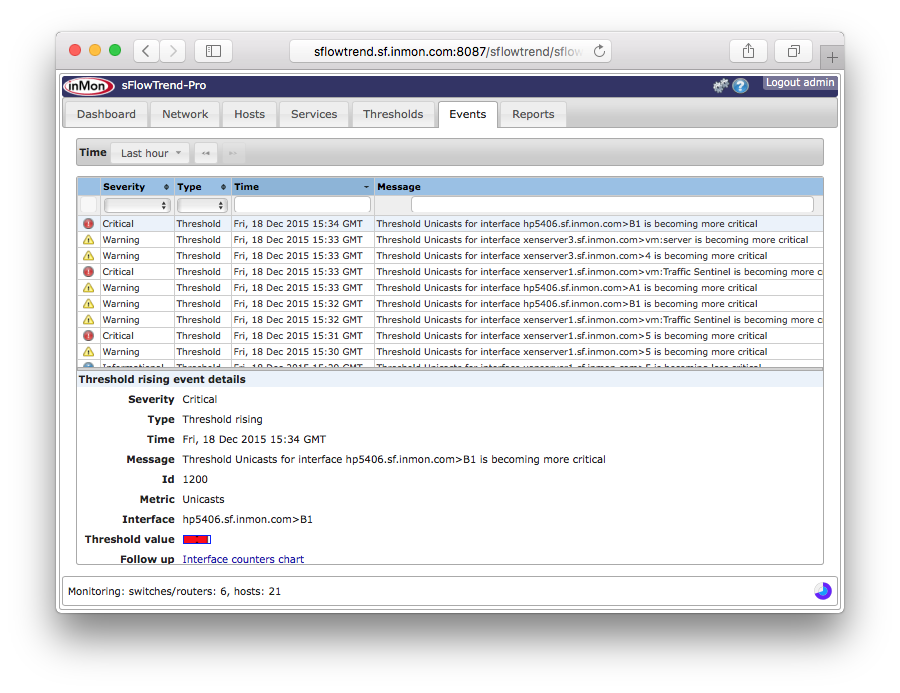
The Events tab lists the events and the summary
information in the Events table.
The tab allows you to view events for a
selected time interval  . You can filter viewed events by
entering a Search string which will match against
the text displayed in the events table.
. You can filter viewed events by
entering a Search string which will match against
the text displayed in the events table.
When you click on an event in the events table, the details of the event are displayed in the Event details pane. Where possible, the event details will include Follow up links. When you click on a follow up, sFlowTrend-Pro will display a view configured with the appropriate setting that gives you background information on the event. For example, for a traffic threshold event, clicking on the follow up takes you to a counters or utilization chart for the switch interface that crossed the threshold.
You can configure sFlowTrend-Pro to notify you when specific events are
raised. See Section 13.6, “Configuring action on events in sFlowTrend-Pro  ”.
”.