1. Introduction
1.1. Introducing sFlowTrend-Pro
sFlowTrend-Pro is a Java application, which monitors sFlow® enabled network switches, routers and hosts. It is designed to be easy to install and use, and to allow network and host problems to be understood and resolved quickly. Summaries and detail of network traffic can be displayed for the whole network, on a per-switch or per-interface level, thresholds used to provide alerts to abnormal traffic conditions, and historical traffic patterns reviewed to determine when changes occurred. Host performance metrics can be monitored for an entire data centre.
As its name implies, sFlowTrend-Pro only monitors sFlow enabled switches, routers and hosts. For the sake of clarity, in the remainder of this documentation network devices will be referred to as switches; if there is an instance where a router has different behavior or requirements, this will be highlighted.
sFlowTrend is a limited functionality version of sFlowTrend-Pro. Throughout this
documentation, sFlowTrend-Pro will be used to refer to sFlowTrend and sFlowTrend-Pro.
Features that only apply to sFlowTrend-Pro will be highlighted with  .
.
sFlowTrend-Pro runs as a client/server application. The sFlowTrend-Pro server runs as a service, continuously in the background, collecting data even when no-one is logged in. A client is used to run the GUI, and view the data from the server. It connects to the server over HTTP or HTTPS using a RESTful API (see sFlowTrend-Pro REST API). Any modern web browser which supports HTML5 can be used to access the GUI (web client). The web client can be run on the same system as the server, or a different one, and multiple web clients can connect to the same server at once.
The sFlowTrend-Pro service is installed via a traditional installer. The installation
starts the service. After each reboot, the service is started automatically and
data collection will resume. The installation also includes a web server which
allows you to run the web client GUI from a web browser pointed at
http://[hostname]:8087/sflowtrend (or over https
https://[hostname]:8443/sflowtrend). See Connecting to sFlowTrend-Pro.
sFlowTrend-Pro has an optional user authentication feature (see
Configuring user authentication  ). If enabled, only users who are authenticated with a
password can access the system and view data. Additionally, some functionality,
for example adding new switches to monitor, is only available to administrators.
If a particular part of sFlowTrend-Pro can only be used by an administrator, this is
highlighted with in this documentation. Note that if user
authentication is not in use, then this does not apply and everyone can access
all of the features.
). If enabled, only users who are authenticated with a
password can access the system and view data. Additionally, some functionality,
for example adding new switches to monitor, is only available to administrators.
If a particular part of sFlowTrend-Pro can only be used by an administrator, this is
highlighted with in this documentation. Note that if user
authentication is not in use, then this does not apply and everyone can access
all of the features.
sFlowTrend-Pro follows a familiar layout of many applications.
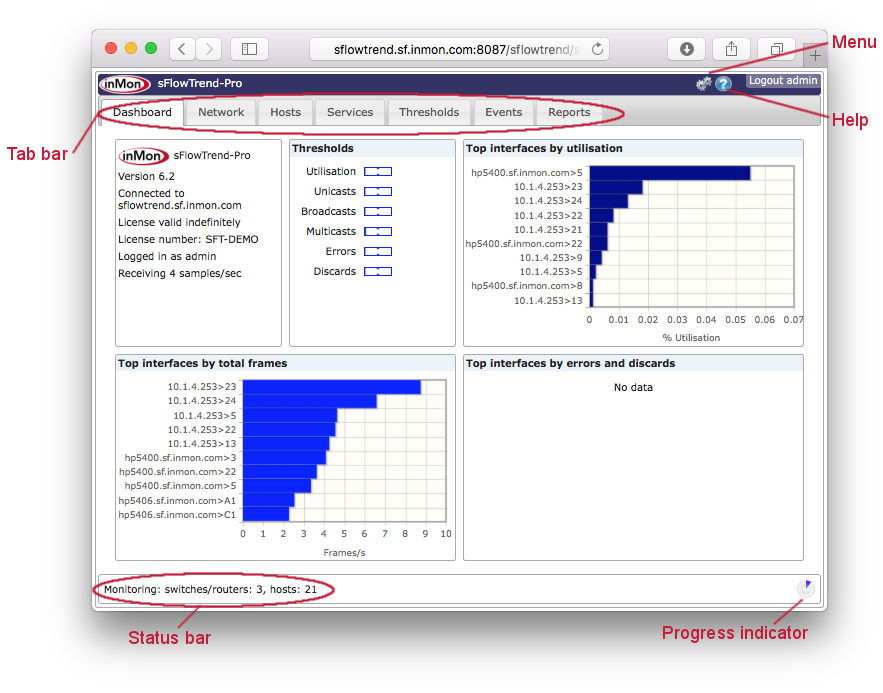
- Menu
-
The menu provides access to configuration tools and other utility functions. A description of the menu items is given in Menu reference.
- Help
-
Clicking on the help icon takes you to the on-line help.
- Tab bar
-
Clicking on a tab will take you to the view associated with that tab. Some parts of sFlowTrend-Pro are equipped with hotlinks, which take you to a different view or tab when clicked (the mouse cursor will change to a hand when this is possible).
- Status bar
-
Along the bottom edge of the window is a status bar, which shows the overall status of the switches and hosts being monitoring, or the status of the currently selected switch if the Network or Threshold tabs are being viewed.
- Progress indicator
-
The progress indicator indicates when the charts and tables will be updated with the most recent traffic and host data. The outer ring in the progress indicator shows the progress through the current minute. The centre of the progress indicator indicates when the chart or table will next be updated. If the chart or table is not being updated automatically, the centre will be shown as a filled circle.
1.2. About sFlow
sFlow® is an industry standard technology for monitoring traffic in computer networks. The sFlow standard is designed and maintained by the industry group (https://sflow.org). Unlike other monitoring technologies, it is very efficient, and so can be used in modern high-speed networks. It also operates at layer two in the network, which means that switched as well as routed traffic can be monitored. Because the overhead of running sFlow on a network is low, it is recommended that sFlow is enabled on as many switch ports as possible in a network. This allows as complete a picture as possible of the traffic to be created. sFlowTrend-Pro helps you automatically configure sFlow on all interfaces, where possible.
sFlow is supported by most network switch manufacturers. An up-to-date list is maintained at https://sflow.org/products/network.php. Even if some of the switches in a network do not support sFlow, because most traffic transits several points in the network, good information on traffic can still be obtained.
With the release of host sFlow, the benefits of sFlow can also be realized for virtual switch, host, and application monitoring. Over time, it is expected that system vendors will integrate host sFlow into their products. In the meantime, you can add sFlow to any host by using the open source host agent, available from https://sflow.net, the Host sFlow site.
1.3. Getting started
Please follow these steps to start monitoring your network traffic with sFlowTrend-Pro. It will also be useful to have the documentation available for your network switches.
-
Ensure that you have some switches or hosts that support sFlow. sFlowTrend-Pro can only monitor switches or hosts using sFlow.
-
The sFlowTrend-Pro service should be started automatically after each reboot. To connect to the service to use the product, point a web browser at
http://[hostname]:8087/sflowtrend(or over httpshttps://[hostname]:8443/sflowtrend). -
Configure the license to allow sFlow to be collected. Refer to
Configuring the license for information on how to set the license.
-
Select
 System configuration menu item and then select the sFlow
tab. Note the sFlow collector address and UDP port that sFlowTrend-Pro is using
to receive sFlow. If your host has multiple IP addresses, they will be accessible
through the collector address selector. Select the most appropriate IP
address for sFlowTrend-Pro to use to receive sFlow.
System configuration menu item and then select the sFlow
tab. Note the sFlow collector address and UDP port that sFlowTrend-Pro is using
to receive sFlow. If your host has multiple IP addresses, they will be accessible
through the collector address selector. Select the most appropriate IP
address for sFlowTrend-Pro to use to receive sFlow. -
Make sure that any host based firewalls, or external firewalls between the host running sFlowTrend-Pro and the switches being monitored allow:
-
UDP traffic from the switches being monitored to the sFlow port on the host running sFlowTrend-Pro.
-
UDP traffic to and from the host running sFlowTrend-Pro to the SNMP port (port 161) on the switches being monitored.
-
-
If you are connecting to a remote sFlowTrend-Pro server, make sure that any host or external firewalls will allow communication between the client and the server. The client uses TCP port 8087 by default to connect to the server.
-
Select
System configuration menu item and then select the SNMP tab.
Choose whether sFlowTrend-Pro should use SNMP v2c or SNMP v3 by default when
communicating with the switches, and enter the appropriate settings for your
network. In addition to these global settings, the SNMP settings can also be
overridden per switch (see Configuring agents in sFlowTrend-Pro ). Note that the SNMP
settings must allow write access if your switches are to be configured using
SNMP (see below). If the switches are configured manually, then settings that
allow read access can be used. -
Next, sFlow should be enabled on the switches you wish to monitor. How this is done depends on the make and model of each switch. Some switches support sFlow configuration through SNMP, while others require that it is manually configured through the configuration interface for the switch (normally the web interface or command line interface (CLI)). In some cases, the switch can be configured either way. SNMP configuration is normally the easiest. Consult the switch vendor’s documentation to determine how sFlow can be configured, and for any specific instructions. See Configuring switches to send sFlow for additional information on configuring switches.
- SNMP configured sFlow
-
If a switch supports SNMP configuration of sFlow, then sFlowTrend-Pro can do most of the configuration work. To do this, select
Configure agents menu item. Click the Add button, and enter the IP
address of the switch you wish to configure. The SNMP settings for the switch
can also be changed from the default global settings here. Select OK on
both dialogs to apply your changes. See Adding a switch configured via SNMP for more
information on configuring switches with SNMP. - Manually configured sFlow
-
To manually configure a switch to send sFlow, consult the switch documentation to determine the specific steps required. Normally, this is done through the web interface or the command line interface on the switch. Connect to the switch (say using a web browser,
sshortelnet). Follow the instructions for the switch to configure it to send sFlow to the IP address and UDP port that sFlowTrend-Pro is using to receive sFlow. You will also need to enable sFlow on one or more interfaces on the switch and set a sampling rate.As soon as sFlow reaches sFlowTrend-Pro, the switch will automatically be added to sFlowTrend-Pro. Even though the switch is not configured through SNMP, configuring sFlowTrend-Pro with SNMP settings that allow read access to the switch will allow information about the switch to be displayed in a more useful way. For example the interfaces can be displayed by name, rather than number. See Configuring agents in sFlowTrend-Pro
for more information on this topic.
-
If you have any hosts that support sFlow, or you are installing the host sFlow agent, then enable these to send sFlow to sFlowTrend-Pro. See Configuring hosts to send sFlow for more information on configuring host sFlow.
-
When sFlowTrend-Pro starts to receive sFlow, the Dashboard tab, Status section, will display the incoming sample rate.
-
Now that your switches are configured to send sFlow, they should be visible within sFlowTrend-Pro. In the Dashboard tab, the status bar will indicate how many switches are being monitored. The Dashboard tab highlights the busiest switch interfaces. See The dashboard.
-
Go to the Network tab, select the Top N sub-tab, and then use the Switch selector to view the traffic information for a specific switch. The default view shows top sources across all interfaces on the switch. You can change the chart displayed using the Chart selector, and view data for a specific interface using the Interface selector. See Top N for more information on network traffic flows charts.
-
To find quickly the interfaces on a switch that are busiest, select the Interfaces sub-tab. This will show a table of all the interfaces on the selected switch. By clicking on the column headings, you can sort by Utilization, Unicasts per second, etc. Once you have found an interface of interest, click the chart button, at the left-hand end of each row, to go directly to the charts for that interface. See Interfaces for more information on this tab.
1.4. Navigating around sFlowTrend-Pro using browser history and bookmarks
You can navigate around sFlowTrend-Pro by selecting tabs in the Tab bar to view and analyze the sFlow data. In addition, sFlowTrend-Pro integrates with the browser history. When you move to a different tab or you change the settings in the viewed tab (for example changing the selected switch, interface or chart in the tab), the tab and its settings changes are automatically saved in the browser history. You can use browser back and forward buttons to move backwards and forwards through the history of viewed tabs and their settings.
You can also use the browser bookmark functions to bookmark favorite tabs and their settings so that you can return to a tab configured with the saved settings at a later time. This is particularly useful if your favorite tabs include many special settings (eg filters).
1.5. Getting help
You can access the sFlowTrend-Pro on-line help by clicking the help icon in the title bar.
If you have trouble with getting sFlowTrend-Pro to work correctly, please refer to
Troubleshooting and frequently asked questions. If you still need help, please submit a support request at
the InMon Corp. customer portal (https://www.myinmon.com) . Community-based support
is available via the sFlowTrend Google Group (https://groups.google.com/group/sflowtrend). There is also
a blog that gives tips and tricks for using sFlowTrend-Pro (https://blog.sflowtrend.com).
For sales questions, please send an email to sales@inmon.com.
2. Installing sFlowTrend-Pro
2.1. Installation
sFlowTrend-Pro is installed using an installer, obtained from https://www.myinmon.com. Download the appropriate installer file for your system: either Windows or Linux. For Linux, you can download either an interactive installer, a Debian package (.deb file), or an RPM file, depending on your preference. If you are installing on Windows or using the interactive installer on Linux, follow the instructions in Using the interactive installer. For more information on installing with a Debian or RPM package, see Installing with a Debian or RPM package.
If you would like to run sFlowTrend-Pro on a Mac, we suggest a Linux VM running under Virtual Box, Parallels or VMWare Fusion, or in a container under Docker (a prebuilt Docker image is available at https://hub.docker.com/r/sflow/sflowtrend/).
After sFlowTrend-Pro is installed, you must configure a license. When the client first connects to the server, a dialog should pop up automatically. This dialog allows you to enter the license number (or choose to use the free version, sFlowTrend). If the dialog does not appear, or you would like to change the license, see Configuring the license for more information. Note that normally sFlowTrend-Pro will use the Internet to download the license key, once the license number has been entered. If a proxy configuration is required for the server to connect to the Internet, please make sure that the proxy is correctly configured (see Proxy configuration).
On initial installation, until you configure the license you cannot
use the rest of the product; this means that the proxy also cannot be
configured.
To work around this, if you have to configure a proxy, first select the option
to use the free sFlowTrend license, then configure the proxy, and finally go
back to the license dialog and enter your actual license number.
If the system has no Internet connectivity at all, then the license key can be entered manually. First, request a manual license key using a support request at https://www.myinmon.com. Once you have the key, then enter it as described in Configuring the license.
2.1.1. Using the interactive installer
On Windows or if using the interactive installer on Linux, follow the instructions in this section after downloading the installer file.
On Windows, just run the file by double-clicking it.
On Linux, you will need to be root to install sFlowTrend-Pro.
If you choose to use the interactive installer, run the installer by typing
# /bin/sh installer where installer is the file you downloaded.
Alternatively make the file executable and then run it.
When you launch the installer, you will be presented with a sequence of installation steps. After the initial welcome screen, you will need to accept the license agreement. Next, choose the directory where you would like to install sFlowTrend-Pro; it is recommended that you accept the default location.
On the next screen you will be prompted for the sFlowTrend-Pro home directory. This is where the database, log files and custom configuration are stored. Using the default directory is recommended, although it can be changed if you would rather use a different location. In particular, please make sure that enough disk space is available to store the database. The disk space required will depend on the type of network traffic seen, and the number of switches being monitored. Several gigabytes will be enough for most installations. Once you have chosen a location, it cannot be changed without reinstalling sFlowTrend-Pro.
After completing the installation, the service is started automatically, and you will have the option of immediately connecting to sFlowTrend-Pro using a browser.
2.1.2. Installing with a Debian or RPM package
If you choose to install sFlowTrend-Pro using a Debian or RPM package, download the appropriate package and then follow your operating system’s normal method for installation. Note that Java version 11 (or later) must be installed prior to installing sFlowTrend-Pro. When installing sFlowTrend-Pro using a package file, the home directory cannot be changed.
2.2. Connecting to sFlowTrend-Pro
You use sFlowTrend-Pro by connecting to it using a web browser (HTML 5 and JavaScript is required in the browser; most modern browsers will work, including Internet Explorer 11 or later, or recent versions of Safari, Firefox or Chrome). Multiple users can connect to the server allowing different people in your organization to access the data easily.
In a web browser go to the URL http://[hostname]:8087/sflowtrend for a regular
connection, or https://[hostname]:8443/sflowtrend for https.
The ports used can be customized as described in
[advanced.configuration.webserver.port] and
[advanced.configuration.webserver.https.port].
Please make sure that no firewalls are blocking these ports on the client
system, the server, or in the network.
2.3. Firewall configuration
To allow the sFlowTrend-Pro server to receive sFlow from the devices that you are monitoring, the incoming sFlow data must be allowed to pass through any firewalls. When using a host firewall with a service, the firewall configuration can be confusing, since the configuration must correspond to the user that the service is running as. See What firewall requirements does sFlowTrend-Pro have? if you are having difficulty in receiving sFlow.
2.4. Notes on installing sFlowTrend-Pro on Linux
After completing the installation of sFlowTrend-Pro on Linux, the sFlowTrend-Pro service
will be created automatically (as /etc/init.d/sflowtrend-server) and
started.
The service will also be registered to automatically start when the system is
booted, using chkconfig.
This is only possible for Linux distributions that use the chkconfig command.
Some distributions use other methods for starting services automatically.
If the Linux that you are using does not use chkconfig, then you should enter
the /etc/init.d/sflowtrend-server service manually as a service to be
started at boot time.
If you are installing sFlowTrend-Pro on a system which does not have a graphical
user interface, you can either install using a package
(see Installing with a Debian or RPM package), or using the interactive installer
but with a terminal interface.
To do this, add the command line option -c to the installer,
eg: # /bin/sh installer -c.
This will step through the same installation steps that are used for the
graphical installer, just using a terminal interface.
Please take care to enter the data correctly, as the command line interface is
more difficult to use than the graphical interface.
2.5. Memory configuration for the sFlowTrend-Pro service
The amount of memory required by the sFlowTrend-Pro service varies considerably, depending on how many sFlow agents are monitored, and the quantity and type of network traffic. The default memory available to the service is generous and suitable for most installations. However, if memory runs low then events will appear in the event log warning of this, and performance of sFlowTrend-Pro may become poor.
To increase the memory available to the service, first go to the bin
directory, in the directory on the server where sFlowTrend-Pro was installed.
Here there should be a file named sflowtrend-server.vmoptions.
Edit this file with a text editor, and add a line to the end with this format:
-Xmx1800mThis will change the memory available to be 1800 MB. The memory can also be reduced in a similar way. After making this change, the sFlowTrend-Pro service must be restarted for the change to take effect.
| It is very important to specify a valid memory configuration. If the directive is typed incorrectly, or has an invalid size of memory, then the sFlowTrend-Pro service will not start. Be aware that with a 32-bit JRE, the maximum memory that can be specified is approximately 1800 MB; if the size is greater than this, then the service will not start. If you are using a 64-bit OS and a 64-bit JRE, then a larger amount can be specified. |
2.6. Configuring https certificates
To allow https to run on the sFlowTrend-Pro server, an https certificate is required. When the sFlowTrend-Pro service is first started, a default certificate will be installed with a generic localhost hostname.
It is possible to configure a different certificate to use for the server, if
for example, you wish to use a certificate signed by a local enterprise
certificate authority.
To do so, you will need to use the command keytool, which is included with
the Java Development Kit (JDK), available from Oracle or the OpenJDK.
First stop the sFlowTrend-Pro service.
Then create the keystore to use with keytool.
The keystore must contain a trusted certificate entry (including a private key),
and should be placed in the sFlowTrend-Pro home directory.
You should then create the custom configuration options
[advanced.configuration.server.https.keyStore],
[advanced.configuration.server.https.alias],
[advanced.configuration.server.https.password] and
[advanced.configuration.server.https.keyPassword] (these are only required if
the desired values are different from the defaults).
When the sFlowTrend-Pro service is then restarted, the new certificate from the
keystore will be used.
If, at any time a new default certificate is required, just stop the sFlowTrend-Pro service, delete the default keystore, and restart the service. A new default keystore will be automatically created.
The sFlowTrend-Pro server can force clients to always use https, rather than http. For information on this please see the [advanced.configuration.webserver.forceHttps] custom configuration option.
3. The dashboard
The dashboard is the screen displayed when sFlowTrend-Pro is first launched. The purpose of the dashboard is to give a summary of the overall status of the network, to help you identify problems quickly. The dashboard contains three main types of information:
-
The overall status of sFlowTrend-Pro.
-
The status of the top-level thresholds.
-
Charts showing the interfaces in the network reporting the largest values of utilization, frames, and errors and discards.
3.1. Status
The status section of the dashboard shows a summary of the overall system, which can be useful for basic troubleshooting.
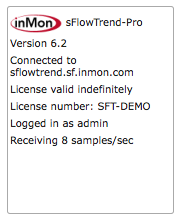
Some of the information shown:
-
To the right of the InMon Corp. logo is the product name. This should be sFlowTrend-Pro if you are running sFlowTrend-Pro, or sFlowTrend if running free sFlowTrend. Also, if you are running sFlowTrend-Pro, information about the current license is shown, including the expiry date, and the license number. If you have multiple copies of sFlowTrend-Pro, the license number is useful if you need to refer to the license you are running when you are using the InMon customer portal (https://www.myinmon.com).
-
The sFlowTrend-Pro server that you are currently connected to is shown.
-
If you have defined users to control access to sFlowTrend-Pro, the username of the currently logged in user is shown.
-
The current rate of incoming samples is shown. This number includes only samples that actually reached sFlowTrend-Pro, and are coming from enabled switches and hosts. If you are seeing no data in sFlowTrend-Pro, this number can help you determine why (see Troubleshooting sFlowTrend-Pro).
3.2. Thresholds
The thresholds section of the dashboard shows the current status of each of the top level thresholds.
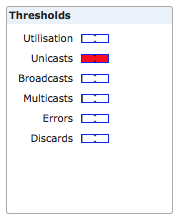
Each threshold category (Utilization, Unicasts, Broadcasts, Multicast, Errors, Discards) indicates the most severely violated threshold across all the switches that you are monitoring. The color of the bar indicates how severe the threshold violation is (green is normal, yellow is marginal and red is critical). Further detail of the threshold value is indicated by how far to the right the threshold bar is within the indicator. For more information on how thresholds work, see Using and configuring thresholds.
You can drill-down to the causes of any threshold violation by clicking on a threshold indicator on the dashboard. This will take you to the thresholds screen, showing the thresholds for all the switches being monitored, sorted by the threshold category that you clicked on. For example, if you click on the broadcast threshold indicator in the dashboard, you will be taken to the thresholds view for all switches, sorted by broadcasts (highest threshold value first). This shows you the detail of the broadcast thresholds across the whole network, and allows you to find the switches contributing the most to threshold violations quickly.
Note that if a switch is deleted from sFlowTrend-Pro, if it was contributing to any of the thresholds shown on the dashboard, then this contribution will not be removed until the end of the current minute.
3.3. Top interfaces
Three 'top interfaces' charts are provided on the dashboard.
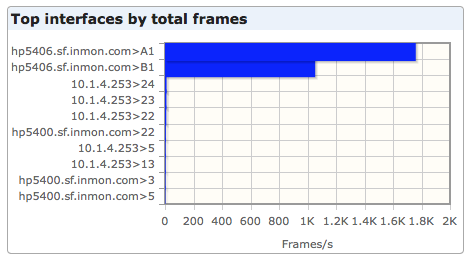
These charts show, in bar chart format, the top 10 switch interfaces sorted by utilization, total frames (unicasts, multicasts and broadcasts), and errors and discards. The bar shows the average over the previous minute. These charts are designed to give you a summary view of the busiest interfaces, or interfaces which are experiencing the highest number of issues. Clicking on any of the bars allows you to drill-down to the traffic charts for that specific interface.
Note that if a switch is deleted from sFlowTrend-Pro, if it was contributing to any of the top interface bar charts shown on the dashboard, then this contribution will not be removed until the end of the current minute.
4. Network
The Network tab displays network performance statistics using sFlow data collected from switches (including virtual switches) and wireless access points. This tab includes a number of sub-tabs that allow you to view the data in different ways:
- Interfaces
-
Sortable table showing the important interface counters (Utilization(%), Unicasts/s, Broadcasts/s, Multicasts/s, Errors/s, Discards/s) values for the most recent minute, for the for the currently selected switch. This tab is useful for comparing the usage of interfaces based on absolute values. See Interfaces.
- Counters
-
Trend charts showing how the overall network traffic load on an interface varies over time. See Counters.
- Top N
-
Trend charts showing the top N contributors to the network traffic and how the top N contributors change over time. See Top N.
- Circles
-
Charts that allow you to visualize the traffic flows between groups of addresses. See Circles.
- Root cause
-
Data analysis to help you understand the root cause of traffic loads including the cause of tripped thresholds. See Root cause.
4.1. Interfaces
The Interfaces tab provides a tabular, sortable view of the values for the most recent minute, of the important interface counters (Utilization(%), Unicasts/s, Broadcasts/s, Multicasts/s, Errors/s, Discards/s) for the currently selected switch.
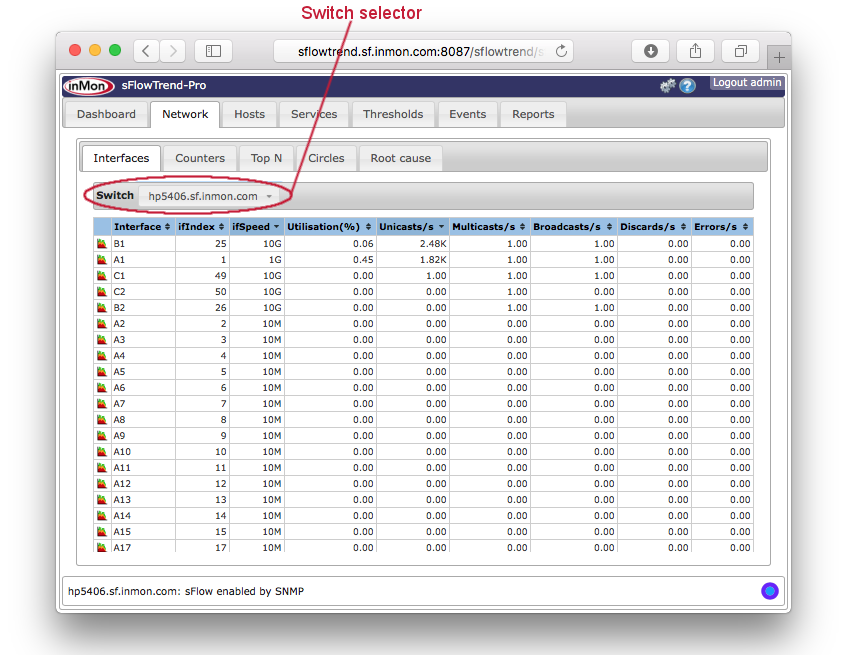
This tab is useful for comparing the usage of interfaces based on absolute values. For example to compare the unicasts/s of interfaces with the same ifSpeed on the selected switch (see Selecting a switch), first click with the Left mouse button on the Unicasts/s column heading, then click with the Shift+Left mouse button on the ifSpeed column heading. This will cause the table to be sorted by unicasts/s and then ifSpeed.
| The Interface column shows the name of the interface using the interface naming policy (see Setting the switch and interface naming policy). This is a useful way to see the name to ifIndex mapping. |
The Progress indicator shows when the counter values will next be updated. When sFlowTrend-Pro first starts collecting sFlow data from a switch, the first counter values will be available after 2 minutes. The counter values will then be updated every minute.
To investigate the cause of the usage values for an interface of interest, click
on the chart  button in the row for the interface. This will automatically
make the Counters tab visible with the interface of interest selected.
button in the row for the interface. This will automatically
make the Counters tab visible with the interface of interest selected.
4.2. Counters
Interface counter charts show how the overall network traffic load on an interface varies over time. These charts are generated from the interface counter data exported by sFlow. Interface counters charts are represented as stacked area charts.
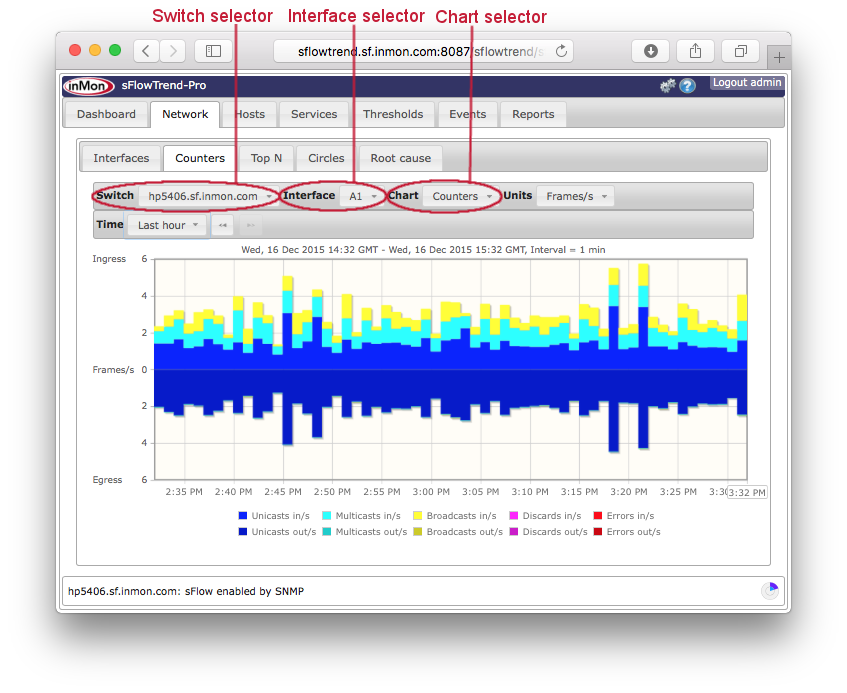
This tab includes a control bar that allows you to select the switch (Selecting a switch)
and interface (Selecting an interface) for which you would like to view trends
in counter values, the counters charts to display and the specific time interval
(see Selecting a time period ).
| When you have made changes to the selections for the chart, you can save these selections in a bookmark (see Navigating around sFlowTrend-Pro using browser history and bookmarks) so that you can easily return to the same chart at a later date. |
With sFlowTrend, or with sFlowTrend-Pro when the Time setting
is relative to now (for example Last hour — see Selecting a time period ), these charts are
automatically updated when the next data point is available.
The Progress indicator shows how long it will be before the chart is next updated.
4.2.1. Counters charts
The following charts are available:
- Utilization
-
This chart shows the utilization trend for the selected interface. The utilization chart is useful for identifying any capacity problems with the interface. If utilization approaches 100% for sustained periods then action should be taken to increase the capacity of the link, reorganize the topology of the network, or limit the applications making use of the link. Change to the Top N tab and use the Top sources chart with Units selector set to Bits/s to start diagnosing the major sources of high utilization.
- Counters
-
This chart shows basic interface counters. The counters chart is useful for examining the number of errors, broadcasts, multicasts or discards on an interface. High error rates can indicate a bad cable or interface card. High discard rates may indicate that the device cannot keep up with traffic. Change to the Top N tab and use the Top broadcast flows or Top IP multicast flows with Units selector set to Frames/s to help identify sources of high broadcast or multicast traffic.
- WAP frame counters
-
This chart shows the trends of 802.11 wireless fragments and multicast frames.
- WAP control frame counters
-
This chart shows the trends for 802.11 wireless control frames: Request To Send Success, Request To Send Failure, Acknowledgement Failure.
- WAP error counters
-
This chart shows the trends for various different types of 802.11 wireless error frames.
- WAP associated stations
-
This chart shows the trends in number of 802.11 wireless end hosts associated with the selected radio interface.
- WAP QoS counters
-
This chart shows the trends for various different types of 802.11 wireless Quality of Service counters.
| The WAP counters charts will only display data if sFlowTrend-Pro is receiving sFlow from wireless devices that support the sFlow 802.11 Structures. |
4.2.2. Units
When the Utilization chart is chosen, the Units selector automatically changes to Bits/s, and cannot be altered. The chart left y-axis indicates bits/s while the right y-axis indicates % utilization of the link bandwidth.
When the Counters chart or one of the 802.11 wireless counters charts is chosen, the Units selector automatically changes to Frames/s and cannot be altered.
4.2.3. Using the legend to view one interface counter
Sometimes the values for one interface counter can be much smaller than the values for other counters, making it hard to see the trend for the smaller counter. In this case, you can remove counter trends from the chart by clicking on the corresponding legend items. For example, when viewing the Counters chart, clicking with the Left mouse button on Unicasts in/s in the legend will change the chart so that the Unicasts in/s trend is removed and the chart is rescaled, making the other trend lines more visible. You can remove all but one of the trend lines. You can redisplay a trend line by clicking on the corresponding legend item again.
4.3. Top N
The Top N tab displays charts that show the top N contributors to the network traffic and how the top N contributors change over time.
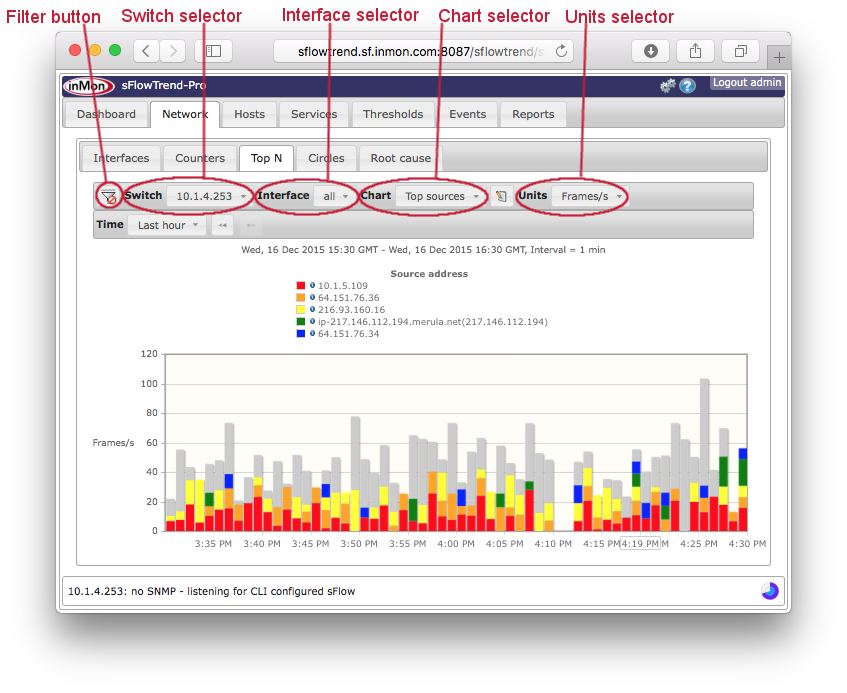
This tab includes a control bar that allows you to select the switch (Selecting a switch)
and interface (Selecting an interface) for which you would like to analyze and view
traffic data, and the type of chart to display.
You can also select a specific time interval (Selecting a time period ) and filter on specific
traffic (Filtering).
| When you have made changes to the selections for the chart, including creating a filter, you can save these selections in a bookmark (see Navigating around sFlowTrend-Pro using browser history and bookmarks) so that you can easily return to the same chart at a later date. |
With sFlowTrend, or with sFlowTrend-Pro when the Time setting is
relative to now (for example Last hour — see Selecting a time period ), these charts are
automatically updated when the next data point is available.
The Progress indicator shows how long it will be before the chart is next updated.
4.3.1. Top N charts
The Top N charts show the top N contributors to the network traffic and how the top N contributors change over time. These charts are generated from the sampled packets exported by sFlow. Top N traffic charts are shown using stacked bar charts.
The following network traffic top N charts are available:
- Top sources
-
The top sources of traffic.
- Top destinations
-
The top destinations of traffic.
- Top input VLANs
-
The VLANs which are providing the most input traffic to the switch.
- Top output VLANs
-
The VLANs which are receiving the most output traffic from the switch.
- Top source-destination pairs
-
The top source address and destination address pairs.
- Top source-destination flows
-
The top source address, source port, destination address and destination port flows.
- Top inter-VLAN pairs
-
The VLANs between which most traffic is flowing.
- Top connections
-
Top connections is similar to Top source-destination flows, but combines both directions of the traffic belonging to a client/server connection.
- Top servers
-
The top servers.
- Top clients
-
The top clients.
- Top protocols
-
The top protocols.
- Top broadcast flows
-
The top flows of broadcast traffic.
- Top IP multicast flows
-
The top flows of IP multicast traffic.
- Most connected sources
-
The top sources ordered by the number of destinations that each source has connected to. This is also referred to as 'fan-out'. This chart is useful for security analysis, to help identify hosts that are exhibiting address scanning behavior.
- Most connected destinations
-
The top destinations ordered by the number of sources that has connected to each destination. This is also referred to as 'fan-in'. This chart is useful for security analysis, to help identify hosts that might be victims of a distributed denial-of-service attack.
- Most popular protocols
-
The top protocols ordered by the number of source/destination address pairs. This chart is also useful for security analysis, and shows the protocols that are most likely being used to perform scanning.
- Top wireless versions
-
The wireless versions in use, for example 802.11a, 802.11g.
- Top SSIDs
-
The top 802.11 wireless SSIDs in use.
- Top channels
-
The top 802.11 wireless channels being used.
- Top cipher suites
-
The top cipher suites being used to encrypt the 802.11 wireless traffic.
| For any Top N charts where the contributors are addresses, the legend will display addresses and their DNS names (where addresses can be resolved to names) if Resolve IP addresses to hostnames in charts is selected in User preferences (see Chart settings) |
| In the VLAN charts, a VLAN of 0 indicates that no specific VLAN is being used, or the VLAN could not be determined. |
| The 802.11 wireless charts will only display data if sFlowTrend-Pro is receiving sFlow from wireless devices that support the sFlow 802.11 Structures |
Custom Top N charts
In addition to the standard Top N charts, you can also define custom Top N charts.
With a custom Top N chart you can choose the attributes (key fields) that are
used to identify the top contributors.
To define a custom Top N chart, click on the edit [ ] button
next to the Chart selector.
This will display the Edit custom Top N dialog.
In the dialog, click on the Add custom Top N button to display a dialog
that allows you to define the key fields for the custom Top N.
] button
next to the Chart selector.
This will display the Edit custom Top N dialog.
In the dialog, click on the Add custom Top N button to display a dialog
that allows you to define the key fields for the custom Top N.
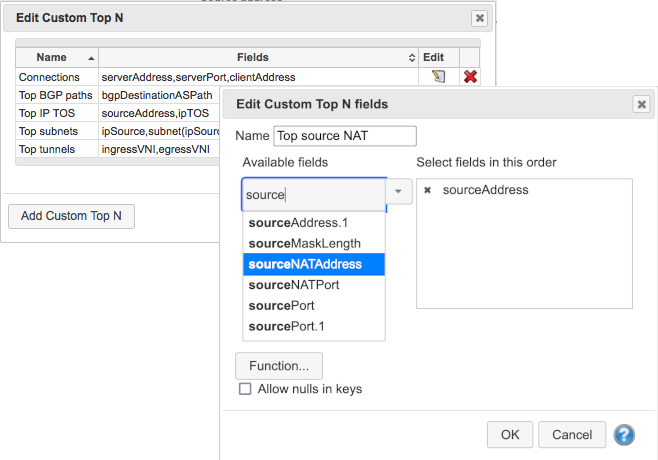
For example, if you would like to see the top source addresses before NAT has taken place and the associated addresses after NAT, select sourceAddress from the Available fields list to add this key field to the selected fields list, then select sourceNATAddress. See Database key fields available for flows for descriptions of the available key fields
You can also use key functions in a custom Top N chart definition. For example, if you would like to see the top subnets sourcing traffic, click on the Function button to bring up the function editor dialog and enter subnet(ipSource). See Key functions for details of key functions.
You can drag fields in the selected fields list to reorder the fields.
The Allow nulls in keys checkbox allows you to specify
whether a top N entry can include flows with keys whose values are null.
For example if you create a custom Top N with macSource
and ipSource fields and check
Allow nulls in keys, top N entries may include layer 2
only flows (eg layer 2 broadcasts, ARP). If you do not check
Allow nulls in keys, then top N entries will only include
flows that have both a MAC layer and an IP layer.
You must enter a unique name for this custom Top N, before you click OK. After you click OK in the Edit custom Top N dialog, the custom Top N will be added to the Chart selector. Custom Top N charts are listed after the standard Top N charts in the selector. You can use the Edit custom Top N dialog to edit or remove existing custom Top N definitions.
The Available fields list includes a type-in text
field that allows you to filter the available fields for fields whose
names match the typed in text.
For example, you can type addr into the type-in field to see only
those fields which include addr in their names.
|
Address translation data is available only if sFlowTrend-Pro is receiving
sFlow from devices that support the extended_nat structure.
|
4.3.2. Units
You can use the Units selector to choose the measurement units used to calculate the top contributors. There are two types of Top N traffic charts:
- Rate-based charts
-
These charts show the top N contributors based on their associated traffic rate in either bits/s or frames/s. Example rate-based charts are Top sources, Top source VLANs, Top broadcast flows. Use the Units selector to choose whether the top contributors should be sorted based on their traffic rate in either bits/s or frames/s.
If a specific interface is selected, then the rate-based charts will show ingress traffic (above the x-axis) and egress traffic (below the x-axis). This shows the top N contributors of traffic entering or exiting the selected the interface. If the Units selector is set to Bits/s, the left y-axis will show the volume of traffic in bits/s, while the right y-axis will show the traffic volume in terms of % utilization of the interface bandwidth. If the Units selector is set to Frames/s, the traffic volume will be shown in frames/s.
If a specific wireless interface is selected, the Units selector includes an additional option, Air %. Air % is the percentage of the available bandwidth used by the traffic, taking into account the actual speed of transmission. Traffic transmitted at a low speed will have high air % utilization. This means that a host with poor signal strength may use a disproportionately large amount of wireless bandwidth and degrade performance for other users.
If the Interface selector is set to All, the charts will show the top contributors over the whole switch. If a connection oriented, client/server chart (Top connections, Top servers, Top clients, Top Protocols) is chosen, the chart will show traffic flowing to the server above the x-axis, while traffic flowing from the server will be shown below the x-axis. For the other rate-based charts, selecting All interfaces results in one overall rate for the switch. You can use the Units selector options of Bits/s and Frames/s to show top contributors based on the their traffic rate in terms of bits/s or frames/s respectively.
- Count-based charts
-
These charts (Most connected sources, Most connected destinations, Most popular protocols) show an absolute count value for each of the top contributors. For example, the Most connected sources chart shows the count of destinations for each of the sources that talk to the most destination hosts. When these charts are selected, the Units, selector automatically changes to Count and cannot be altered.
4.3.3. Understanding the Top N traffic chart
The legend in the Top N traffic chart shows the top contributors for
the selected interval.
The outlined time stamp, for example  , on the x-axis
indicates the currently selected interval.
You can select an interval and see the top contributors in that interval
by clicking with the Left mouse button on the bar corresponding
to the interval of interest.
Each other bar in the chart will then be recolored to show how much
traffic was generated, in the interval represented by the bar, by the
top contributors from the currently selected interval.
This allows you to see how the top contributors change over time.
, on the x-axis
indicates the currently selected interval.
You can select an interval and see the top contributors in that interval
by clicking with the Left mouse button on the bar corresponding
to the interval of interest.
Each other bar in the chart will then be recolored to show how much
traffic was generated, in the interval represented by the bar, by the
top contributors from the currently selected interval.
This allows you to see how the top contributors change over time.
If you are having difficulty in selecting a specific bar (because a mouse drag is detected and therefore a range is selected), you can use Control+Left mouse button (or on a Mac Command+Left mouse button) to select the bar.
If the latest (right most) bar is selected and the Time
setting is relative to now (for example Last hour — see Selecting a time period ), the charts will be updated automatically and always
display the contributors for the most recent minute.
The grey part of each bar represents traffic not attributable to the top N shown in the legend (ie it represents the contribution from other sources, destinations etc. that are not in the top N).
If the whole of a bar is grey, the traffic in its interval is not attributable to any of the top contributors in the currently selected interval. You can click on this bar to make it the currently selected interval and see its top contributors.
4.3.4. Displaying end host information
You can find out more information about an end host by clicking on
 to the left of the host address in the legend.
This will open the Lookup host dialog using the end host address.
If the Lookup host dialog is already open, then the dialog will
be changed to show information for the newly selected host.
See End host information for more information.
to the left of the host address in the legend.
This will open the Lookup host dialog using the end host address.
If the Lookup host dialog is already open, then the dialog will
be changed to show information for the newly selected host.
See End host information for more information.
4.3.5. Using the legend to drill-down on specific traffic
You can use the legend in the network traffic top N charts to drill-down on traffic of interest. For example, if you are viewing a Top sources chart and you notice that one host is responsible for the majority of the traffic, you can investigate who this host is talking to and which application is generating the traffic by clicking with the Left mouse button on legend item that corresponds to the host. The Top source-destination flows chart will then be displayed with a filter for the selected host applied. This will show you the top source-destination flows for which the host of interest is the source.
See Filtering for specific traffic for more information of filtering on specific traffic.
4.3.6. Filtering for specific traffic
sFlowTrend-Pro allows you to filter information displayed in a Top N traffic chart. This allows you to focus on traffic that may be of interest. For example, if you only wanted to look at web traffic, you could set a filter for only TCP port 80 traffic. See Filtering for details.
4.4. Circles
The Circles tab allows you to visualize the traffic flows between groups of addresses. For example, grouping end host addresses for each department allows you to view traffic between departments. Understanding network traffic in this way allows you to make accurate capacity planning decisions (eg, do I need to upgrade the link between the finance and the HR department?) and help enforce usage policies (are unauthorized hosts accessing the admin servers?).
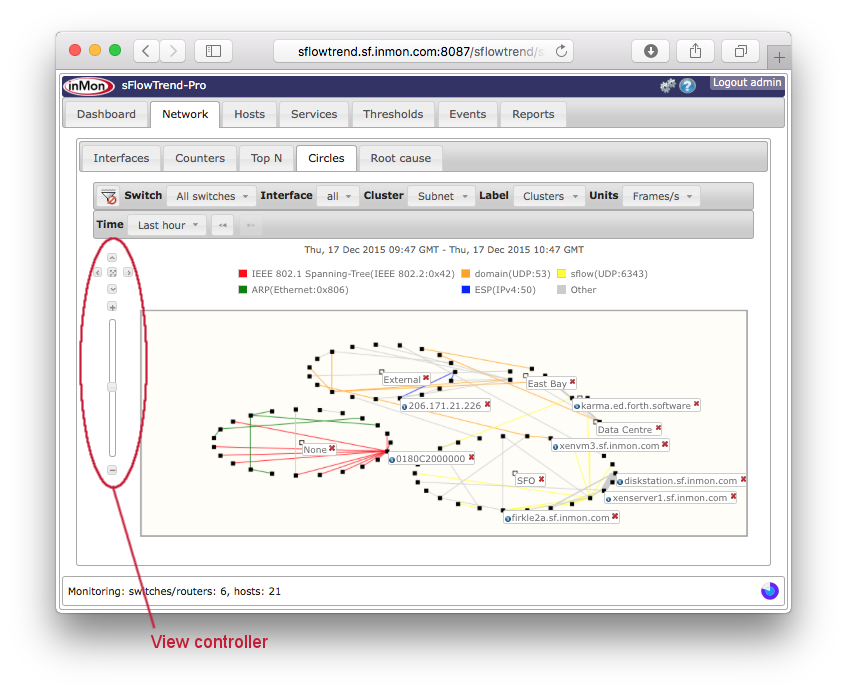
A Circles chart shows the top 100 traffic flows, with the end hosts which are responsible for the top 100 flows displayed as black squares, and clustered together in circles. Lines, colored according to the traffic type, join the end hosts, of a flow. The width of a line is scaled according to the volume of traffic in the flow. The traffic type (or protocol) for each color is shown in the chart legend. The legend entries are ordered left to right, ordered by the volume of each traffic type.
The Circles tab includes a control bar that allows you to select the switch (Selecting a switch) and interface (Selecting an interface) for which you would like to analyze and view traffic data, whether the top flows should be determined by frames or bytes, and whether the clusters and flows should be labelled automatically. You can also select specific time intervals and filter on specific traffic.
| When you have made changes to the selections for the circles chart, including creating a filter, you can save these selections in a bookmark (see Navigating around sFlowTrend-Pro using browser history and bookmarks) so that you can easily return to the same chart at a later date. |
4.4.1. Clustering end hosts
When end hosts are grouped in clusters, they are displayed as a circle of black squares. You can use the Cluster selector to choose how to cluster the end hosts. Currently, sFlowTrend-Pro supports end host clustering options:
- Subnets
-
The end hosts, which are responsible for the top 100 flows, are grouped together according to their subnet. You must configure sFlowTrend-Pro with the subnets in your network for the end hosts to be clustered correctly (see Configuring subnets in sFlowTrend-Pro
).
Any hosts with IP addresses that are not contained within the configured
subnets will be displayed in a separate cluster named External.
If the top flows are for L2 traffic (for example L2 broadcasts, ARPs or
spanning tree) then the end hosts responsible for these flows will be grouped
in a separate cluster named Non-IP. - Country
-
The end hosts, which are responsible for the top 100 flows, are grouped together according to the country in which the IP addresses of the end hosts are located. A host with an IP address, for which the country cannot be determined, will be displayed in a separate cluster named Unknown. If the top flows are for L2 traffic (for example L2 broadcasts, ARPs or spanning tree) then the end hosts responsible for these flows will be grouped in a separate cluster named Non-IP.
- Switch
-
The end hosts, which are responsible for the top 100 flows, are grouped together according to the switch that they are most closely connected to. This allows you to understand traffic that stays within a switch and traffic that crosses multiple switches. A host which cannot be located to a switch, will be displayed in a separate cluster named Unknown.
4.4.2. Automatically labelling chart elements
The Label selector allows you to select how sFlowTrend-Pro should automatically label the elements in the chart. Elements that are automatically labelled will be labelled when the chart is loaded with the latest data. The following options are supported:
- No labels
-
Labels will not be displayed automatically, however you can label selected end hosts or clusters by clicking on the corresponding element in the chart (see Automatically labelling chart elements).
- Cluster
-
Labels are displayed automatically for clusters.
- Top hosts
-
Labels are displayed automatically for the end hosts which are responsible for the highest volume of traffic and are responsible for the largest number of flows.
- Clusters and flows
-
Labels are displayed automatically for clusters and for the end hosts which are responsible for the highest volume of traffic and are responsible for the largest number of flows.
| If Resolve IP addresses to hostnames in charts is selected in User preferences (see Chart settings), then end host labels will show DNS names for addresses when the addresses can be resolved. |
4.4.3. Units
You can select which traffic volume units are used to determine the top 100 flows that are displayed in the chart. If you change the Units selector to Bits/s then the flows which contributed the highest volume of traffic in bits/s are displayed. If you change the Units selector to Frames/s then the flows which contributed the highest volume of traffic in frames/s are displayed.
4.4.4. Changing the time selection
The Circles chart gives a graphical representation of the top 100 flows during the selected time period. The Time selector allows you to select the time period for which data is to be displayed.
For the Circles charts a time interval selection is defined by a start and end time. The Time selector includes the following, commonly used, time interval selections:
-
Last 5 mins
-
Last 10 mins
-
Last 15 mins
-
Last 30 mins
-
Last hour
-
Custom
The Custom option Gives full flexibility in accessing the stored historical data. Set the desired start and end times for the interval, then click the OK button to cause the chart for the selected interval to be displayed.
When a non-custom time period is selected, the displayed chart will be automatically updated when the next data point is available, thus displaying a rolling window of data.
The Time selector also includes back  and
forward
and
forward  buttons that can be used to view data for the
previous or next time interval.
For example if the time selection is Last 5 mins and the
current time is Mon 21 Dec, 2023 11:44, clicking on the back arrow will
cause the previous 5 minutes of data, ending at Mon 21 Dec 2023, 11:39,
to be displayed (using the Custom time selection). The
back and forward buttons will be inactive if the current time selection is
at the beginning or the end of the stored data.
buttons that can be used to view data for the
previous or next time interval.
For example if the time selection is Last 5 mins and the
current time is Mon 21 Dec, 2023 11:44, clicking on the back arrow will
cause the previous 5 minutes of data, ending at Mon 21 Dec 2023, 11:39,
to be displayed (using the Custom time selection). The
back and forward buttons will be inactive if the current time selection is
at the beginning or the end of the stored data.
| sFlowTrend-Pro interprets the selected time period in the server time zone. Similarly, The resulting chart title displays the time period in the server time zone. |
4.4.5. Selectively labelling chart elements
In addition to automatically labelling chart elements, you can selectively
label chart elements by clicking on the element of interest.
To show a label for an end host, click on the black square for the end
host; to show a label for a cluster, click on the white square in the
centre of the circles, to label a flow click on a line.
To remove a label, click on  in the top right
corner of the label.
in the top right
corner of the label.
4.4.6. Displaying end host information
You can find out more information about an end host by first clicking on the
black square for the end host to display the label, then click on .
This will open the Lookup host dialog using the end host
address.
If the Lookup host dialog is already open, then the dialog
will be changed to show information for the newly selected host.
See End host information for more information.
4.4.7. Pan and zoom
The chart includes a view controller that allows you to zoom in and out; pan left, right, up, and down; and reset the chart to fit in the window. In addition you can zoom in and out using the mouse wheel and pan by dragging the mouse with the Left button held down.
4.4.8. Filtering for specific traffic
sFlowTrend-Pro allows you to filter the information displayed in the chart. This allows you to focus on traffic that may be of interest.
You can specify a filter using the Filter bar (see Basic use of filters). In addition you can click on a label for an end host or a flow to automatically filter on traffic for the labelled end host or flow. You can also click on the legend entries to filter on traffic for specific protocols.
4.5. Root cause
The Root cause tab helps you to understand the root cause of traffic on a switch or interface, and optionally the cause of a threshold being tripped.
4.5.1. Selecting the data to analyze
As with the other network tabs, the first step is to determine which traffic you want to analyze. Start by selecting the switch and interface in the usual way. You can restrict the traffic to just that which has contributed to tripping a threshold by using the Threshold selector, or set this to All traffic to analyze everything, regardless of thresholds.
You can use the Minimum weight selector to remove less important data from the results, to make the table quicker to load and easier to understand. The weight is explained below.
4.5.2. Understanding the results
This is an example of the root cause results table:
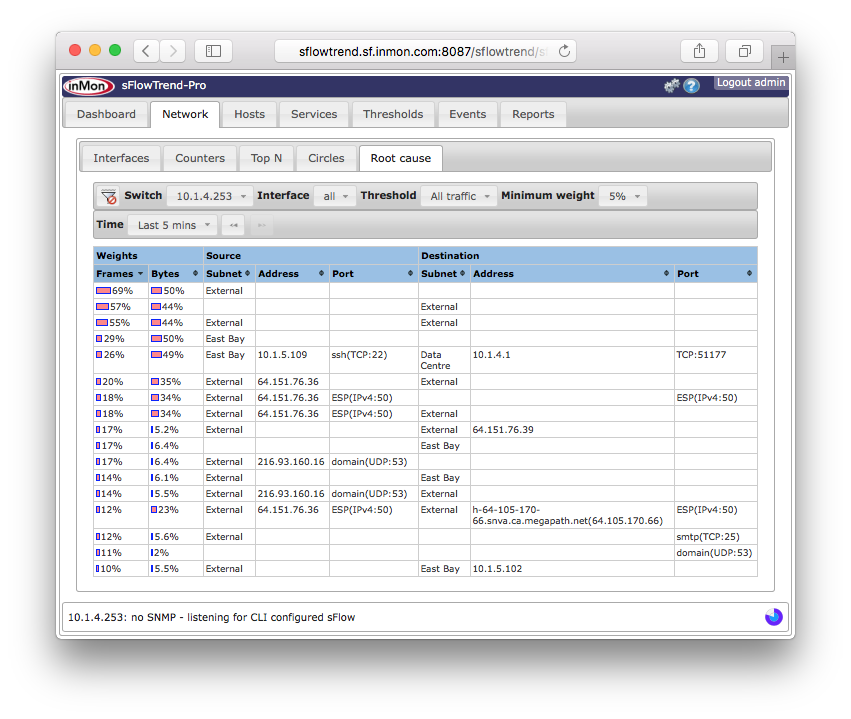
The table is divided into three sections: the Weights of the traffic in the row, details of the Source of the traffic, and details of the Destination of the traffic.
The Weights show the percentage of frames that each row is present in (for the Frames column) and the percentage of bytes of traffic each row is present in (for the Bytes column).
The Source and Destination sections each consists of three columns: Subnet, Address and Port. The meaning of these is:
- Subnet
-
If the address falls within a configured subnet, then the name of the subnet will be displayed, otherwise the subnet will be shown as "External". If this entry is blank, it means "any" or "wildcard".
- Address
-
The address of the traffic (source or destination, depending on the column). This field will either contain an address, or be blank, signifying "any" or "wildcard".
- Port
-
The port of the traffic (source or destination, depending on the column). This field will either contain a port, or be blank, signifying "any" or "wildcard". Each row in the table shows the percentage of the frames and bytes that the row contributes to. Any blank fields are wildcards (any subnet, address or port).
You can use the data in the table to identify the key contributors to traffic (for a switch or interface, for all traffic or just where a threshold has been tripped, depending on the selectors used). For example, in the screenshot above, we can see that 69% of all frames and 50% of all bytes for the switch displayed are sourced from the External subnet (as all other fields are blank). Similarly, 57% of frames and 44% of bytes are sent to the External subnet. Looking towards the bottom of the table, 12% of frames and 5.6% of bytes are from the External subnet and being sent to TCP port 25. This highlights that the rows are not additive; each row may be a super-set or subset of other rows (the external source to port 25 is a subset of the first row, just external source).
If you click with the Left mouse button on the frames or bytes entries in a row, you can drill-down to the data specified in that row — a filter will be created using the other fields in the row. This is an easy way to understand the traffic that the row is composed of.
4.6. Selecting a switch
To view data for a specific switch, use the Switch selector in the
control bar to select the switch you are interested in.
The Switch selector lists the switches that have been
included in the sFlowTrend-Pro configuration, or that sFlowTrend-Pro is receiving
sFlow data from (see Configuring agents in sFlowTrend-Pro for details on configuring
switches in sFlowTrend-Pro). A switch is listed using its SNMP IP address, sFlow
agent address, DNS Name, or sysName (see Setting the switch and interface naming policy).
In the Top N and Circles tabs, the
Switch selector also includes an option All switches.
When you select All switches, the resulting charts display
the overall traffic through the network, such that, if traffic crosses
multiple switches, the traffic is counted only once.
If you would like to restrict the analysis to specific switches, you can do
so by using a filter, for example: agent == "10.0.0.250" || agent = "10.0.0.248",
where 10.0.0.250 and 10.0.0.248 are the sFlow agent addresses of the
switches that you are interested in (see Filtering for specific traffic for more
information of filtering). The All switches option is not
available in the Interfaces or Counters tabs,
since interface counters are specific to a specific switch and interface.
Switches shown in italics in the selection list are disabled, meaning that data
is not being stored for these switches.
See Configuring agents in sFlowTrend-Pro for help on enabling and disabling switches.
Multiple switches can be enabled in sFlowTrend-Pro , whilst sFlowTrend
allows five switches to be enabled at a time.
4.7. Selecting an interface
The Counters, Top N, and Circles tabs allow you to view data for a specific interface. Use the Interface selector in the control bar to select the interface that you are interested in. The Interface selector lists the interfaces for the currently selected switch, for which sFlow data is being received and stored. An interface is listed using its ifIndex, ifName, or ifAlias. (see Setting the switch and interface naming policy). Changing the interface selection causes a chart for the newly selected interface to be displayed.
In the Top N and Circles tabs, the Interface selector also contains an option All. Selecting this option allows you to view traffic flows through the whole switch (across all interfaces). This option is not available in the Counters tab, since counter charts can only display data for a single interface.
5. Hosts
Network convergence, virtualization and cloud computing blur the line between network and system management. To understand performance in this environment you need to monitor both network and server resources. The Host sFlow standard, https://sflow.org/developers/specifications.php, defines the physical and virtual server performance metrics that a Host sFlow agent exports using the sFlow protocol. The Host sFlow agent provides scalable, multi-vendor, multi-OS performance monitoring with minimal impact on the systems being monitored.
For information on configuring host sFlow agent, see Configuring hosts to send sFlow.
The Hosts tab presents host performance statistics for hosts that are sending Host sFlow to sFlowTrend-Pro. This tab includes two sub-tabs providing different views of the host performance data:
- Statistics
-
This sub-tab allows you to and compare performance of all servers, virtual-machines and clusters across the whole network. See Statistics.
- Charts
-
This view allows you to trend performance metrics for any individual server or virtual-machine. See Charts.
The ability to directly relate server performance to the corresponding network traffic is a key element in unifying network and system management.
5.1. Statistics
The Statistics sub-tab allows you to compare performance of all hosts over the last minute. Use the View selector to select the group of performance metrics (CPU, Memory, Disk, Network) of interest.
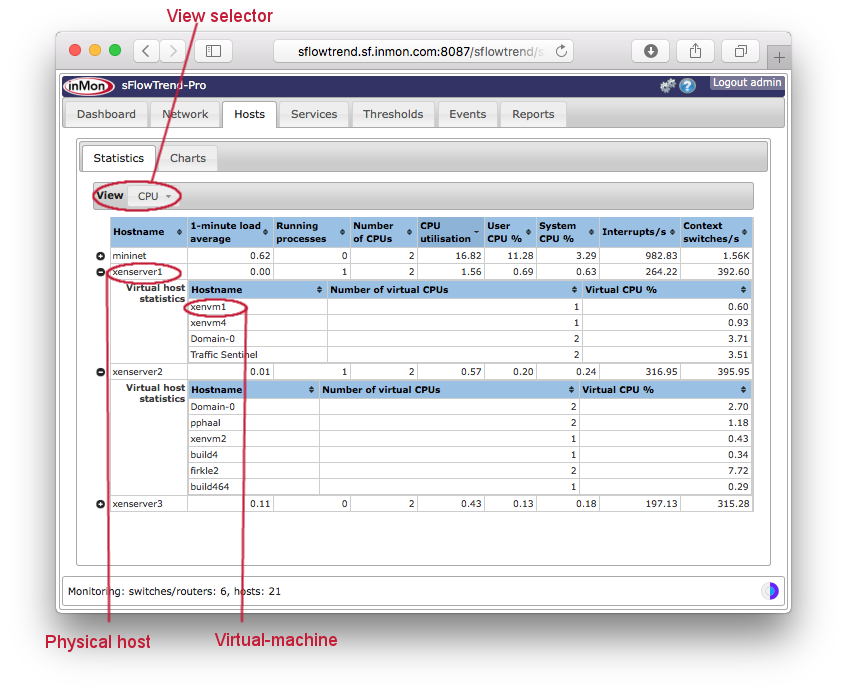
The selected performance metrics for the last minute are displayed in a sortable, hierarchical table, with one row for each host. Physical hosts are shown at the top level of the hierarchy. If the virtual-machines of a physical host are being monitored with sFlow, you can view the performance metrics for the virtual-machines by expanding the physical host.
This view is useful for comparing the current performance of hosts. For example, to compare the CPU utilization of all the hosts, click with the Left mouse button on the % CPU column heading, to sort the hosts by CPU utilization.
To view the trend in performance for a host, click with the Left mouse button on the row of data for that host. The tab will then change to the Charts sub-tab, showing a trend of the performance metrics for the selected host for the last hour.
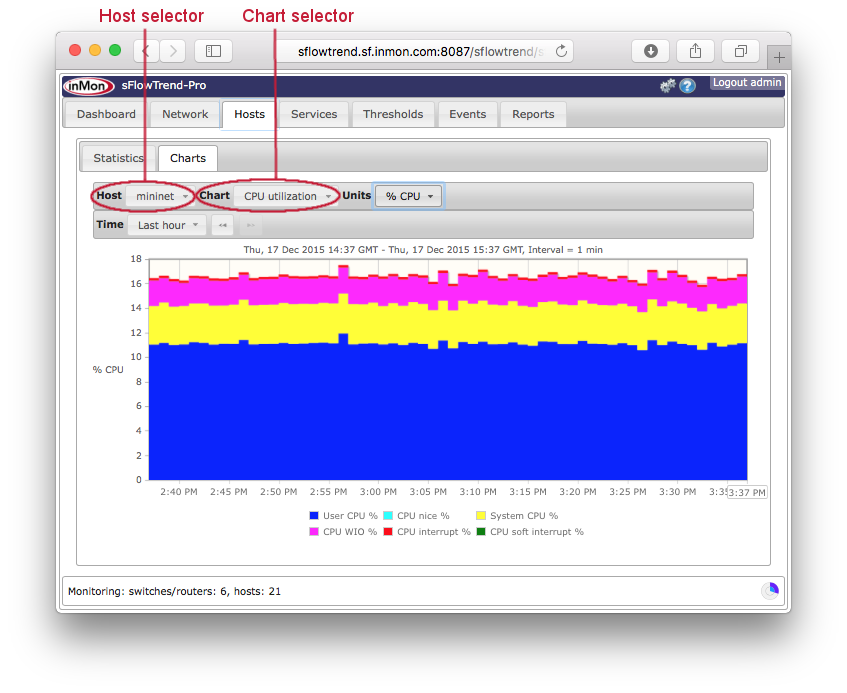
5.2. Charts
The Charts sub-tab allows you to view a trend in performance
for a host.
Use the Host selector to select the host of interest and
the Chart selector to select the performance metrics to trend.
You can also select specific time interval (Selecting a time period ) over which to
trend the data.
5.2.1. Physical host charts
If you select a physical host, the following charts are available:
- CPU Utilization
-
The CPU utilization for each of the following categories: user, nice, system, IO wait, IRQ, Soft IRQ.
- CPU load
-
1 minute, 5 minute, and 15 minute load averages.
- Processes
-
Number of CPUs and number of processes running.
- Interrupts
-
Number of interrupts/s and number of context switches/s.
- Memory usage
-
Memory usage for each of the following categories: used, shared, buffers, cache, free.
- Memory paging
-
Pages/s in and out.
- Memory swapping
-
Pages/s swapped in and out.
- Disk IO
-
Bytes/s read and written.
- Disk usage
-
Disk space used and free.
- Network bytes
-
Bytes/s received and sent over the network interfaces.
- Network packets
-
Packet/s received and sent for each of the following categories: packets, drops, errors.
5.2.2. Virtual host charts
If you select a virtual machine, the following charts are available:
- vCPU utilization
-
% time that the CPU is busy.
- vMemory usage
-
Memory used and free.
- vDisk IO
-
Bytes/s read and written.
- vDisk usage
-
Disk space allocated and available.
- Network bytes
-
Bytes/s received and sent over the network interfaces.
- Network packets
-
Packet/s received and sent for each of the following categories: packets, drops, errors.
5.2.3. Using the legend to select one counter
Sometimes one performance counter value can be much smaller than the other performance counters, making it hard to see the the smaller counter value trend. In this case, you can remove counter trends from the chart by clicking on the corresponding legend items. For example, when viewing the CPU Utilization chart, clicking with the Left mouse button on User CPU % in the legend will change the chart so that the User CPU % trend is removed and the chart is rescaled making the other trend lines more visible. You can remove all but one of the trend lines. You can redisplay a trend line by clicking on the corresponding legend item again.
6. Services
The Host sFlow standard, https://www.sflow.org/developers/specifications.php, defines application performance metrics that a Host sFlow agent exports using the sFlow protocol. A number of popular applications now include sFlow monitoring. For example, sFlow agents are now available for popular web servers, providing scalable performance monitoring of large web server clusters and load balancers.
The Services tab presents application performance statistics for services that are being monitored using sFlow. This tab includes two sub-tabs:
The ability to directly relate server and application performance to the corresponding network traffic is a key element in unifying management of cloud environments.
6.1. Counters
The counters tab shows how the overall volume of application transactions varies over time. It uses stacked area charts to display the application performance counters.
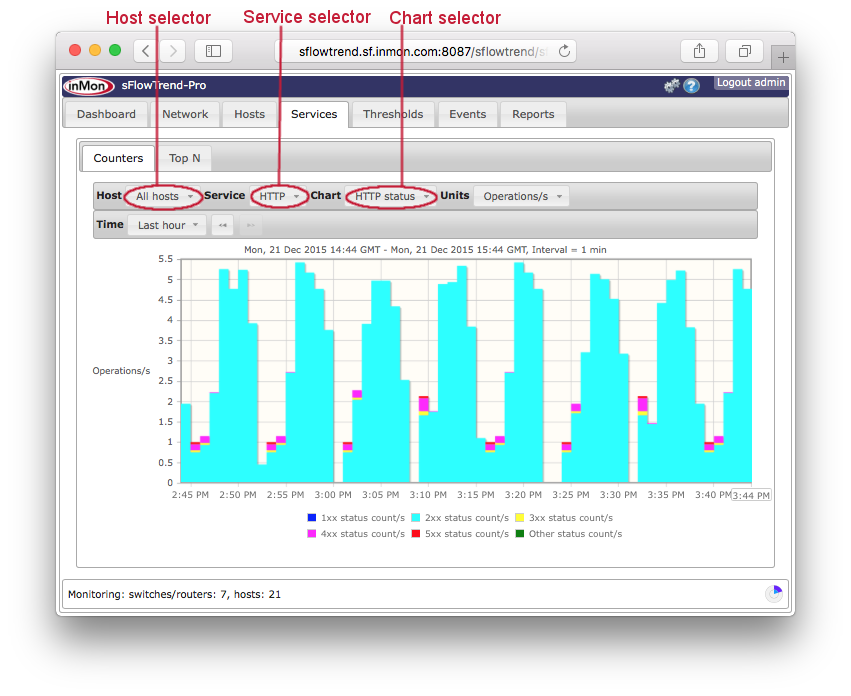
This tab includes a control bar which allows you to select the host and
service for which you would like to view trends in transaction volumes, the
application performance counters chart to display and the specific time
interval (see Selecting a time period ).
| When you have made changes to the selections for the chart, you can save these selections in a bookmark (see Navigating around sFlowTrend-Pro using browser history and bookmarks) so that you can easily return to the same chart at a later date. |
6.1.1. Counters charts
The following charts are available:
- HTTP method
-
The trend in the number of operations per second for the various HTTP methods.
- HTTP status
-
The trend in the number of operations per second with the various HTTP status codes.
6.1.2. Using the legend to view one counter
Sometimes one performance counter value can be much smaller than the other performance counters, making it hard to see the the smaller counter value trend. In this case, you can remove the other counter trends from the chart by clicking on the corresponding legend items. For example, when viewing the HTTP status chart, clicking with the Left mouse button on 2xx status count/s in the legend will change the chart so that the 2xx status count/s trend is removed and the chart is rescaled, making the other trend lines more visible. You can remove all but one of the trend lines.You can redisplay a trend line by clicking on the corresponding legend item again.
6.2. Top N
The top N tab displays trend charts showing the top contributors to application transaction volume and how the top contributors vary over time. For example, you can view the top URIs for a specific host or all hosts.
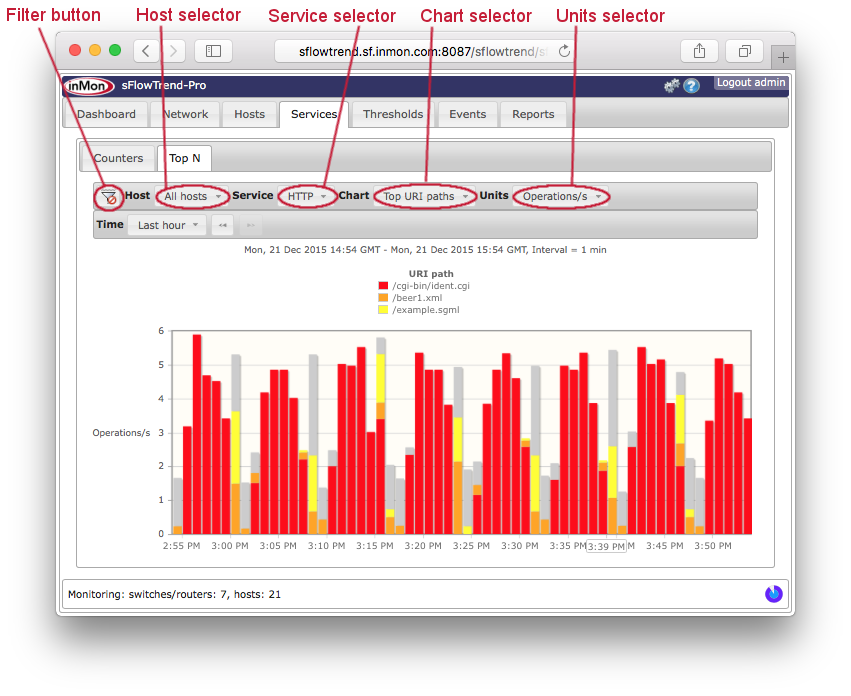
This tab includes a control bar which allows you to select the host and
service for which you would like to view top n trend data and the type
of chart to display.
You can also select a the specific time interval (see Selecting a time period ), and
filter on specific data (see Filtering).
| When you have made changes to the selections for the chart, including creating a filter, you can save these selections in a bookmark (see Navigating around sFlowTrend-Pro using browser history and bookmarks) so that you can easily return to the same chart at a later date. |
6.2.1. HTTP top N charts
The following top n charts are available for understanding the top contributors to HTTP transaction volume:
-
Top methods
-
Top URIs
-
Top URI paths
-
Top URI files
-
Top URI extensions
-
Top URI hosts
-
Top URI paths
-
Top mime types
-
Top auth users
-
Top user agents
-
Top referrers
-
Top X-Forwarded-For
-
Top servers
-
Top clients
-
Top connections
6.2.2. Units
You can use the Units selector to choose the performance measurement used to calculate and display the top contributors. The following units are available:
- Bytes/s
-
Calculates the top contributors based on the number of bytes/s in requests and responses.
- Operations/s
-
Calculates the top contributors based on the number of operations per second.
- Duration
-
Calculates the top contributors based on the mean duration of each transaction.
6.2.3. Understanding the Top N services chart
The legend in the Top N services chart shows the top contributors for
the selected interval.
The outlined time stamp, for example , on the x-axis
indicates the currently selected interval.
You can select an interval and see the top contributors in that interval
by clicking with the Left mouse button on the bar corresponding
to the interval of interest.
Each other bar in the chart will then be recolored so that it shows the
transaction volume associated with the top contributors in the currently
selected interval.
This allows you to see how the top contributors change over time.
If you are having difficulty in selecting a specific bar (because a mouse drag is detected and therefore a range is selected), you can use Control+Left mouse button (or on a Mac Command+Left mouse button) to select the bar.
If the latest (right most) bar is selected and the Time
setting is relative to now (for example Last hour — see Selecting a time period , the charts will be updated automatically and always
display the contributors for the most recent minute.
The grey part of each bar represents transaction volume not attributable to the top N shown in the legend (ie it represents the contribution from other URIs, methods etc, that are not in the top N).
If the whole of a bar is grey, the transaction volume in its interval is not attributable to any of the top contributors in the currently selected interval. You can click on this bar to make it the currently selected interval and see its top contributors.
6.2.4. Displaying end host information
When Top servers, Top clients, or
Top connections charts are displayed, you can find out more
information about an end host by clicking on
to the left of the host address in the legend.
This will open the Lookup host dialog using the end host
address.
If the Lookup host dialog is already open, then the dialog
will be changed to show information for the newly selected host.
See End host information for more information.
6.2.5. Using the legend to drill-down into service data
You can use the legend in the services top N charts to drill-down into the service data. For example, if you are viewing a Top URI hosts chart and you notice that most of the activity involves one URI host, you can investigate which URIs for this host are being accessed by clicking with the Left mouse button on legend item that corresponds to the URI host. The Top URIs chart will then be displayed with a filter for the selected URI host applied.
See Filtering for more information of filtering.
6.2.6. Filtering for specific data
sFlowTrend-Pro allows you to filter information displayed in a Top N
services chart.
This allows you to focus on data that may be of interest.
For example, when viewing Top URIs, if you only wanted to
look at URIs accessed with HTTP GET, you could set a filter
httpMethod=="GET".
See Filtering for details.
7. Using and configuring thresholds
Thresholds allow you to identify specific problems in your network quickly. When you set a threshold, you are defining what is considered to be normal traffic levels for a switch or interface. If that traffic level is exceeded, then the threshold fires, and is highlighted for further investigation or action.
Thresholds are configured and monitored on the Thresholds tab in sFlowTrend-Pro.
The Thresholds tab allows you to view the current status (from the previous minute) of different thresholds (see Viewing thresholds). You can also drill-down to identify the root cause of a threshold violation (see Root cause analysis) and to view the trend of the traffic levels.
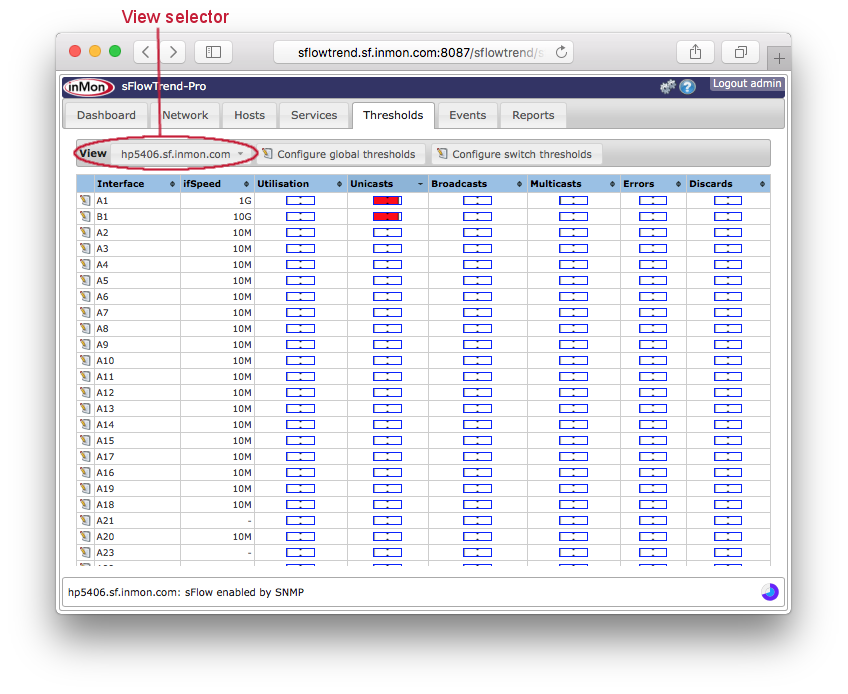
7.1. Viewing thresholds
You can view and configure the thresholds for all switches, or for all interfaces on a specific switch. Use the View selector to select the view that you would like. The options are:
- All Switches
-
Displays a table of thresholds for each switch.
- All Interfaces
-
Displays a table of thresholds for every interface on each switch.
- Customized thresholds
-
Displays only the thresholds for switches or interfaces that have been customized (see Defining thresholds
). - Switch name or address
-
If you select a specific switch (by name or IP address, depending on the switch naming policy configured in User preferences), the thresholds for each interface on that switch are displayed.
The current threshold values are shown in the table. Each column can be sorted by clicking on the header column. If you click on a column containing thresholds, then the column will be sorted by the current threshold values in the column. This is an easy way to find the thresholds with the highest values (ie, those that have 'most exceeded' the configured thresholds).
7.2. Threshold values and types
Every threshold has a current value, which is displayed by the threshold
indicator  . The value ranges from 0 - 100%,
and the position of the bar in the indicator shows this value.
In addition, as the threshold value exceeds predefined levels, the color
of the indicator will change.
If the threshold value is below the normal level, then the indicator is
shown in green.
As the threshold value reaches 70%, the threshold becomes marginal, and
is shown in yellow.
At 90%, the threshold is critical, which is indicated by red.
. The value ranges from 0 - 100%,
and the position of the bar in the indicator shows this value.
In addition, as the threshold value exceeds predefined levels, the color
of the indicator will change.
If the threshold value is below the normal level, then the indicator is
shown in green.
As the threshold value reaches 70%, the threshold becomes marginal, and
is shown in yellow.
At 90%, the threshold is critical, which is indicated by red.
The value of the threshold is defined by two factors: the trigger, and how long the threshold must have triggered for. For example, for the errors threshold, you might consider that the trigger is 5 errors per second. The duration might be 4 out of the previous 10 minutes. If the number of errors per second was 5 or more, in at least 4 out of the previous 10 minutes, then the threshold value would be 100%. The percent value is a combination of how long the trigger was exceeded for, relative to the configured setting, and how close the parameter being monitored was to the trigger.
To make it easier to find interfaces which have exceeded thresholds, the value of the threshold propagates up from a switch interface to the overall threshold value for the switch, and from there to the overall threshold value for the network as a whole. The maximum threshold value propagates up, so that the overall value for a switch is the largest of the values for each of its interfaces.
Thresholds can be set on six different parameters:
- Utilization
-
The percent utilization of an interface.
- Unicasts
-
The number of unicast frames per second.
- Broadcasts
-
The number of broadcast frames per second.
- Multicasts
-
The number of layer 2 multicasts per second.
- Errors
-
The number of errored frames per second.
- Discards
-
The number of discarded frames per second.
When viewing the threshold table, you can click with the Left mouse button on any threshold indicator to investigate the root cause of the threshold value (see Root cause analysis).
Clicking with the Left mouse button on a switch in the threshold table, the table will change to display the thresholds for all interfaces of the selected switch.
7.3. Defining thresholds
Thresholds can be defined per interface, per switch, or globally. If a threshold is defined for a switch, then that threshold setting is used for each of the interfaces of the switch, unless specific thresholds for interfaces themselves are defined. Similarly, the global threshold setting is used for all switches and interfaces, unless overridden at the switch or interface level.
A threshold is configured using the edit threshold dialog. This can opened in a number of ways:
-
Click the Configure global thresholds button on the threshold tab, to set the global thresholds. These will apply if a more specific threshold is not configured.
-
When viewing a specific switch on the threshold tab, click the Configure switch thresholds button to configure the switch thresholds. These will apply if more specific interface thresholds are not configured.
-
Similarly, when viewing all switches in the threshold tab, click the edit [
] button to the left of the switch name to
configure that switch’s thresholds. -
Finally, when viewing a table of interfaces (ie by selecting All interfaces, or a single switch), a specific interface’s thresholds can be configured by clicking the edit [
]
button to the left of the interface number or name.
A useful way to see which thresholds have been customized is to select Customized thresholds to view. This will show all the switch and interface thresholds which have been customized, allowing their status to be observed, and their configuration changed.
When you open the edit threshold dialog, you can then enter the settings desired for each threshold parameter.
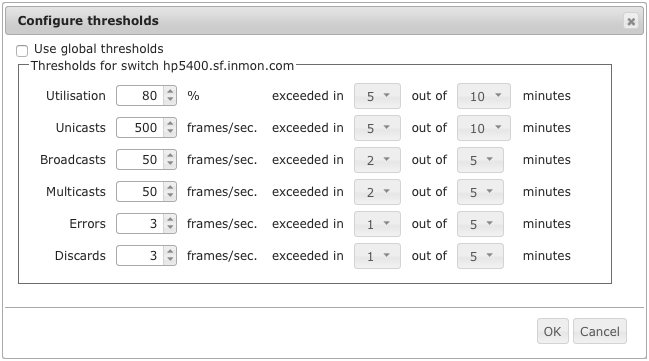
See Threshold values and types for a description of the settings for each threshold. By default, a switch threshold will be set to the global threshold setting, and an interface threshold will be set to the threshold setting for its switch. To customize the threshold, first uncheck the Use global thresholds (for a switch) or Use switch thresholds checkbox (for an interface), to allow the settings to be changed. If you want to remove the custom settings, and revert to the default, just re-check the checkbox.
7.4. Root cause analysis
When viewing the threshold table, you can click with the Left mouse button on any threshold indicator; a menu will be shown that allows you to drill-down further and determine the cause of the threshold violation. If you click on a switch threshold, then you can select Root cause from the menu which will take you to the Network, Root cause tab configured to analyze the selected threshold for all interfaces of the switch (see Root cause). If you click on an interface threshold, then you can choose View chart, which will take you to the Network, Counters tab configured with the selected interface and counters chart, or you can choose Root cause which will take you to the Network, Root cause tab configured to analyze the selected threshold and interface (see Root cause).
8. Events
sFlowTrend-Pro raises events when various conditions are detected. Traffic threshold events are raised when traffic levels cross the defined thresholds (see Using and configuring thresholds). System events are raised when various conditions in the operation of sFlowTrend-Pro are detected (for example when users connect to or disconnect from sFlowTrend-Pro or if an error occurs). Schedule report events are raised when a schedule reports runs, completes, or has an error. You can view these events in the Events tab.
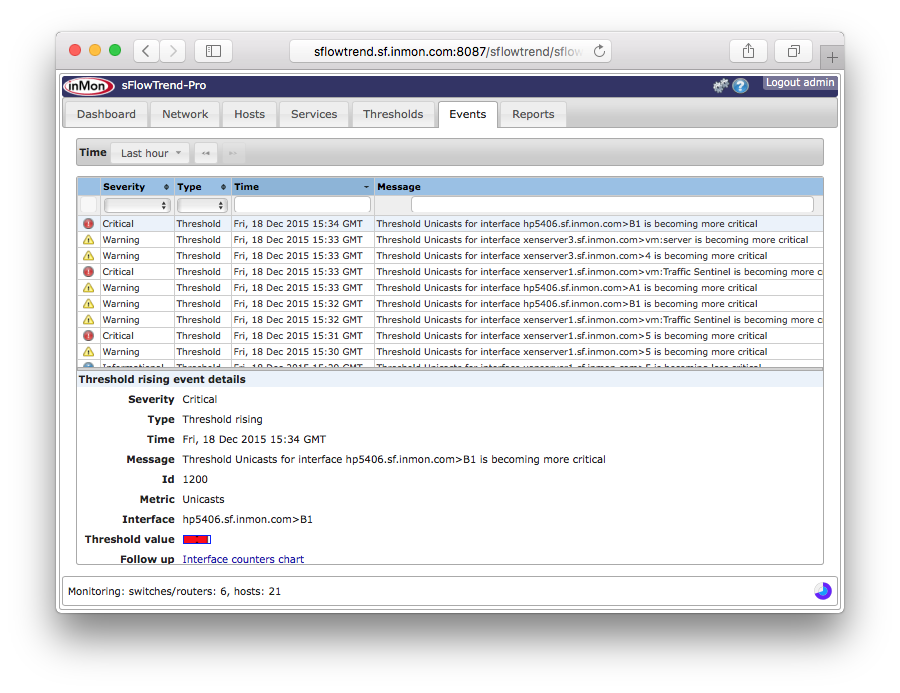
The Events tab lists the events and the summary information
in the Events table.
The tab allows you to view events for a selected time interval .
You can filter viewed events by entering a Search string
which will match against the text displayed in the events table.
When you click on an event in the events table, the details of the event are displayed in the Event details pane. Where possible, the event details will include Follow up links. When you click on a follow up, sFlowTrend-Pro will display a view configured with the appropriate setting that gives you background information on the event. For example, for a traffic threshold event, clicking on the follow up takes you to a counters or utilization chart for the switch interface that crossed the threshold.
You can configure sFlowTrend-Pro to notify you when specific events are raised.
See Configuring action on events in sFlowTrend-Pro .
9. Reports
The Reports tab allows you to define custom reports, run reports (manually or automatically on a defined schedule), and view and save the results of running a report.
A report definition consists of a description to describe the purpose of the report, an optional schedule to run the report automatically, and a number of report sections. There are two types of report section:
- Query section
-
A query section is used to define a query that will extract data from the sFlowTrend-Pro database and display results in tabular or graphical formats.
- HTML section
-
An HTML section is used to embed text and other material in a report. For example an HTML section can be used to add a title and description for the data shown in a query section.
Running a report definition produces report results. These results can be saved so that they are available later and accessible to other users.
The Reports tab includes two sub-tabs:
- Reports
-
Hierarchical view of all reports and their sections and settings. This sub-tab allows you to manage all your reports, for example, create new reports, edit and delete existing reports, and organize reports in folders. It also allows you to view the results of reports that have been run.
- Scheduled reports
-
Sortable table of reports that have been scheduled to run automatically. This table includes information about the current status and performance of scheduled reports. It also allows you to cancel a scheduled report that is running.
9.1. Managing all reports
The Reports sub-tab includes a reports browse pane that allows you to view existing report definitions, create and delete report definitions, and add and delete sections to report definitions.
When you first install sFlowTrend-Pro a number of example report definitions will be installed in the System reports folder.
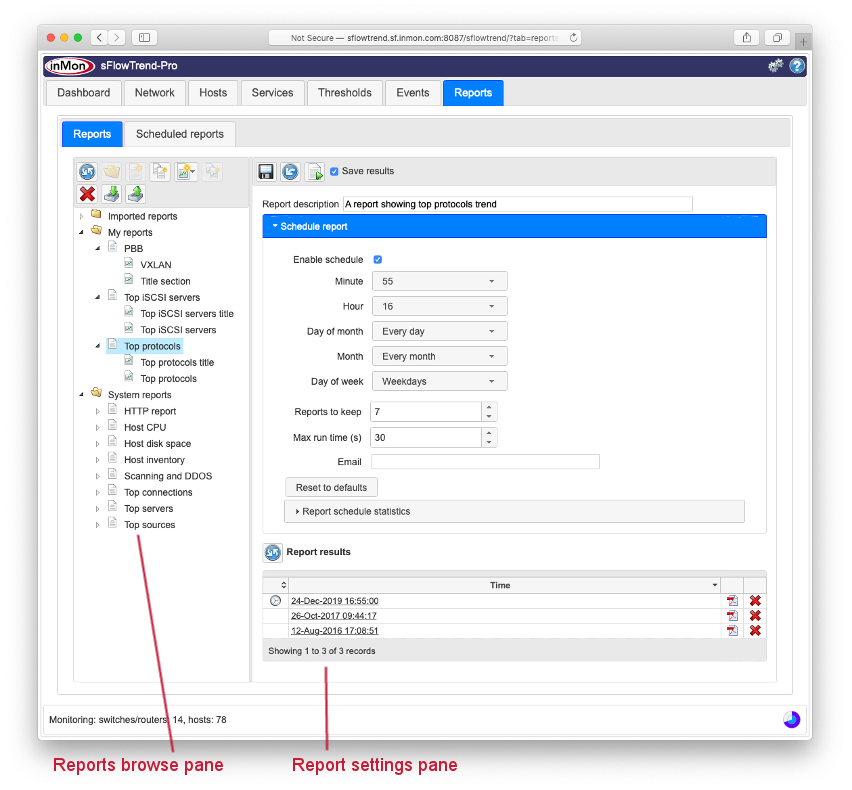
The Reports sub-tab also includes a report settings pane that allows you to change the settings for a report and its sections. It also includes a number of controls:

-
Allows you to save any changes to
the settings.
This control is only active if you are an administrator and you have
changed the settings of the report.

-
Allows you to undo any changes to the settings since the last save. This control is only active if you have changed the settings.

-
Allows you to run the report definition, including all the sections with the current (possibly unsaved) settings. The resulting report will be opened in a new window. Optionally if you are an administrator, you can save the results, by checking the Save results checkbox
before you run
the report definition, so that the results are available later and
accessible to other users.
9.1.1. Organizing report definitions
The reports browse pane allows you create, edit, and delete report definitions. It also allows you to organize report definitions in folders. Folders, report definitions and report sections are shown using icons:


-
Open or closed folder. Folders are always shown sorted alphabetically.

-
Report definition. Report definitions are always shown sorted alphabetically within a folder.

-
Report section.
The reports browse pane includes a tool bar with a number of buttons which allow you to create and organize report definitions. It also allows you to rearrange report definitions using drag and drop. You can access common tasks by clicking with the Right mouse button and selecting from the menu.
 Adding a folder
To add a new folder in an existing parent folder, first select the parent
folder and then click the new folder button.
To add a new folder at the top level, make sure that there is no selection
in the reports browse pane, and then click the new folder button.
The new folder button will be active only when a folder is selected or
there is no selection.
 Adding a report definition
To add a new report definition, first select the folder which will contain
the new report definition, then click the new report
button.
The new report button will be active only when a folder is selected.
 Copying a report definition
To copy a report definition, first select the report definition that you
want to copy, then click the copy report
button.
A copy of the report definition will be created in the same folder as the
original report definition.
You can use drag and drop to move the copied report definition to another folder.
The copy report button will be active only when a report definition is selected.
 Adding a report section
To add a new report section, first select the report definition in which to
add the new section, then click the new section
button, and then select either HTML section, Query section,
or Scripted query section.
The new section button will be active only when a report definition is selected.
 Copying a report section
To copy a report section, first select the report section that you would like
to copy, then click the copy section button.
A copy of the report section will be created in the same report definition as
the original report section.
You can use drag and drop to move the copied report section to another report
definition.
The copy section button will be active only when a report definition is selected.
 Deleting a folder, report definition or report section
To delete a folder, report definition, or report section, first select the folder,
report definition or report section, then click the delete button.
The delete button will be active only when there is a selection.
You can also delete the current selection by clicking with the Right mouse
button and selecting Delete from the menu.
Importing and exporting report definitions
sFlowTrend-Pro allows you to import report definitions and export report definitions so that they can be imported into another sFlowTrend-Pro installation.
To import a report definition, click on the import button  .
This brings up a dialog which allows you to select a previously exported report
definition and import it into sFlowTrend-Pro.
The report definition will be imported into the Imported reports folder
in the Reports tab.
.
This brings up a dialog which allows you to select a previously exported report
definition and import it into sFlowTrend-Pro.
The report definition will be imported into the Imported reports folder
in the Reports tab.
To export a report definition, first select the report that you would like to export.
Then click on the export button  .
The definition for the selected report will be downloaded to the web browser’s
download location.
The exported report definition can then be transferred to another sFlowTrend-Pro
installation or shared with other users.
The export button will be active only when a report is selected.
You can also export a selected report definition by clicking the Right mouse
button and selecting Export.
.
The definition for the selected report will be downloaded to the web browser’s
download location.
The exported report definition can then be transferred to another sFlowTrend-Pro
installation or shared with other users.
The export button will be active only when a report is selected.
You can also export a selected report definition by clicking the Right mouse
button and selecting Export.
 Reloading report definitions
Administrators can make changes to report definitions and how they are organized.
To load changes that other administrative users have made click on the reload
reports button.
Changing the name of a folder, report definition or report section
You can change the name of a folder, report definition, or report section by clicking on the folder, report definition or report section. Or you can click with the Right mouse button on the current selection and select Edit name from the menu. You will be allowed to rename a folder, report definition or report section if you choose a name which is unique among siblings.
When you change the name of a folder, the folders in the parent folder will be resorted alphabetically. Similarly, when you change the name of a report definition, the reports within the folder will be resorted alphabetically.
Reorganizing reports and sections using drag and drop
The reports browse pane supports drag and drop. You can use drag and drop to move a folder to a different folder, move a report definition to a different folder, reorder sections within a report, or move a section to a different report. You will be allowed to move a folder, report definition or report section only if the move will not duplicate a name.
9.1.2. Editing report definitions
When you select a report definition or section in the reports browse
pane, you can then edit its settings in the report settings pane.
You can edit the description for the report definition, define a schedule
to run the report automatically (see Scheduling a report ), and view
saved report results (see Viewing report results).
| The report description describes the purpose of the report. This description is not shown in the report results. To add a description to a report result you can add an HTML section to the report. |
9.1.3. Scheduling a report
When you select a report definition in the reports browse pane, the reports settings pane includes an expandable section, Schedule report, which allows you to configure a report to run automatically on a schedule.
To define a schedule for a report, first select Enable schedule.
This will then activate all the report schedule configuration fields.
sFlowTrend-Pro uses a cron expression to define a schedule.
A cron expression for the schedule comprises five fields (Minute,
Hour, Day of month, Month, Day of week)
each of which can be set with a selector.
The selectors allow you to select the most commonly used options, or to
select Advanced for more complex expressions.
When you select Advanced for a field, a text input field will be
displayed and you can use this to enter a custom string for that field.
For example, to schedule a report to be run at 16:55, on weekdays, every month, set the selectors as shown in the screenshot at Managing all reports.
Deselecting Enable schedule disables the report from being run on a schedule, but retains the configured schedule settings.
In addition, specifying a schedule on which to run a report, you can also configure the following settings:
- Reports to keep
-
Number of scheduled report results to keep. The oldest results of running a report are deleted to ensure that no more than the specified number of results are kept. Report results that were generated by running a report manually are not affected by this setting.
- Max run time (s)
-
The maximum time the scheduled report should be allowed to run (in seconds). If the scheduled report exceeds this time, it will be cancelled automatically.
-
Email address to send report results to after the report has been run on the schedule. You can specify a number of email recipients by entering a comma separated list of email addresses. For this setting to work you must first configure sFlowTrend-Pro with the email SMTP server (see Email).
The Reset to defaults button stops the report from running on a configured schedule and removes the schedule settings.
After you have made changes to the schedule settings, you must click the
save button .
The Schedule report section also includes an expandable section Report schedule statistics which indicates when the the report was last run and how long it took to run (on the currently configured schedule), and the current scheduled state.
9.1.4. Viewing report results
When you select a report definition, the reports settings pane includes a table of saved report results. Each row in the report results table shows the time at which the report results were generated and also the following columns:

-
Indicates that the report result was generated when the report was run automatically as defined by the schedule.

-
View the report results in PDF format.
-
delete the report results.
To refresh the report results table, to load report results
that have been generated by other users, click the refresh
button under the report results table.
9.1.5. Editing a query section
When you select a query section in the reports browse pane, the report settings pane will display the settings for the query section. In a query section you can define a query to specify the data that you want to extract from the database, and a display format for the data that is produced when the query is run.
A query specifies the data that you want to extract from the database.
When a query is run it produces a table of results.
When you define a query you are specifying the columns or fields
that should be present in the table.
A column can be a key field, for example sourceAddress, or
a value field, for example bytesTotal.
Each row in the table will represent a unique combination of the
keys and values associated with that combination.
For example, if a query is defined to have the fields sourceAddress
and bytesTotal, then the query will produce a table of data where
each row in the table includes a unique source address and the bytes
sent by that address.
sFlowTrend-Pro supports commonly used, basic queries defined using Basic settings (see Editing a query using basic settings), flexible, complex queries using Advanced settings (see Editing a query using advanced settings), and flexible, complex queries with the ability to further process the results before display using Scripted settings (see Editing a query using scripted settings).
When you add a new query section, a default query section will be created with Basic settings. You can edit these settings in the Basic settings tab, or if you are defining a more complex query, you can view the basic settings in the Advanced settings tab or the Scripted settings tab, and then edit the settings in one of these tabs. However, if you edit the settings in the Advanced settings tab, the settings will become incompatible with the Basic settings, so you will only be able to view and edit the query settings in the Advanced settings tab and Scripted settings tab. Similarly, if you edit the settings in the Scripted settings tab, the settings will become incompatible with the Basic settings and Advanced settings so you will only be able to view and edit the query settings in the Scripted settings tab.
Defining how query results are displayed
The table of data produced when a query is run can be displayed in a number of different formats. You can select the most appropriate format for your use of the data. Displaying the data in a Table gives the raw data from the query; use this if you need the actual numbers. For example, you might want to check on the absolute utilization of a link, or use the data in another application. Displaying the data in a Chart helps visualization of the results; use this if you want to compare different items quickly, for example, easily see the largest contributors to the utilization of a link. Another important difference between using a table and a chart is that a chart must have a value to plot. A table does not require a value, and so can be used to answer questions such as "which addresses were seen on a specific interface?".
In addition to choosing between a table and a chart, you can also decide whether to view the data as a total over the entire time period selected for the query, or as a trend of data over time. If you view the data as a total, then rows in the table represent data points for the whole time period. In this case, the interval from the time selector is ignored. If, however, you want to understand how a value changes over time, then you should select a trend. With a trend, each row in the table represents a data point for a period of time defined by the time selector interval.
If we use the Top Sources by frames query as an example, displaying the result of this query as a total will give the total frames sent by each of the top sources over the time period. Displaying the result as a trend will show how the number of frames sent by each of the top sources changed over time.
When a chart is used to display query results, the chart interprets results data using series, categories and values. sFlowTrend-Pro will choose the most appropriate fields to plot as categories and series based on the type of chart selected.
- Categories
-
Categories are plotted on the x-axis of a chart. Charts that show data as totals have explicit categories, defined from the key fields that were used in the query. The categories are generated from all the unique combinations of the key fields found in the data. For example, if the key fields were
sourceAddressanddestinationAddress, then there will be a category for source-destination pair found in the data.Charts that show data as a trend over time use time as categories. Each category corresponds to an interval in the overall time period of the query.
- Values
-
Values are plotted on the y-axis of a chart. The value fields in the results form the values for the chart. Each category will a plotted against each of the values.
- Series
-
Each series contains a set of related data. How a series is plotted depends on the type of chart. For example, a bar chart will show each series as a set of bars of the same color, and each category will have a bar of each color. A stacked bar chart shows only one bar per category, but each bar will contain several segments, with each segment representing a series.
For charts that show data as totals, a series is generated for each value field in the results. For example, if the value fields were
framesTotalandbytesTotal, then one series is created for frames, and one for bytes. Recall that for a totals chart the categories are created from the key fields; this means that each series is formed from the associated value field plotted against each category.For charts that show data as a trend, the series are generated from the key fields in the results. This is done in a similar way to the categories in a totals chart: each series will consist of the unique combinations of the key fields found in the results data. For example, if the key fields consisted of
sourceAddress, then a series would be created for each source address found in the results. These series are then plotted against time.
The display format information panel (see Editing a query using basic settings) is useful in understanding how a query will be plotted. When a query is created in the basic or advanced settings tabs, then the categories, series and values that will be produced are shown. For time trend charts, since the categories are always time, this is assumed and not shown in the information panel. Similarly, for a totals chart, since the series are always generated from the values, the series are not shown. In the case of a table, the columns that will form the table are shown.
The following formats can be used to display the data:
- Bar chart (totals)
-
Displays the data in a bar chart, with bars used to show the values for each series in the data. Bar charts are used to display and compare data summarized over the query time period.
If one series is available (in the query one value is selected), then a single bar per category is shown. If multiple series are present, then a group of bars is plotted for each category, with the bars colored to indicate the series.
- Stacked bar chart (totals)
-
Displays the data in a stacked bar chart. This is similar to a normal bar chart, and when only one value field is selected in the query, produces the same result. However if multiple values are selected in the query, a series is generated for each value, and instead of plotting a separate bar for each series, a stacked bar is used. Each segment of the stacked bar represents a different series.
This type of chart is useful when two similar values are to be compared, for example
framesInandframesOutfor an interface. - Line chart (trend)
-
Displays the data in a line chart trended over time. Each series in the data will be shown as a separate line in the chart, plotted against the categories. Use this chart to see how data changes over time.
A line in the chart is plotted for each series. With advanced charts, if more than one value is selected, a separate chart will be created for each value.
- Area chart (trend)
-
Displays the data in an area chart trended over time. Each series in the data will be shown as an area in the chart. The areas for each item will overlap, which can make the results of this chart difficult to see. You could try a line chart or stacked area chart if this is the case.
As with the line chart, each area in the chart is formed from the series, and a separate chart will be created if multiple values are specified.
- Stacked area chart (trend)
-
The stacked area chart is identical to the area chart, except the areas are stacked on top of each other, rather than overlapping. This can make the chart much easier to read.
- Table
-
Use a table to view the raw results of your query. The table will include a column for each field specified in the query. It is not necessary for the query to include value fields, so a table is useful for inventory reports, where you want to understand what is present, rather than how much traffic is being generated.
All the columns for the query will be displayed in the table.
- Table (trend)
-
The trend table also displays data in a tabular form, but includes time as the first column. Use this type of table to get the specific values from a query, instead of the visualization provided by charts.
All the columns for the query will be displayed. Each row in the table will include the time, and associated data for that time. If there are multiple data points per time period, then there will be multiple rows with the same time. Also, if there are any data points which are the 'other' from a top-n query, then they will be shown with the non-value columns blank (the columns for value fields will show the value for 'other').
Editing a query using basic settings
The Basic settings tab helps you define and parameterize commonly used queries. These queries are very similar to those used in the Network tab (see Network), Hosts tab (see Hosts), and Services tab (see Services).
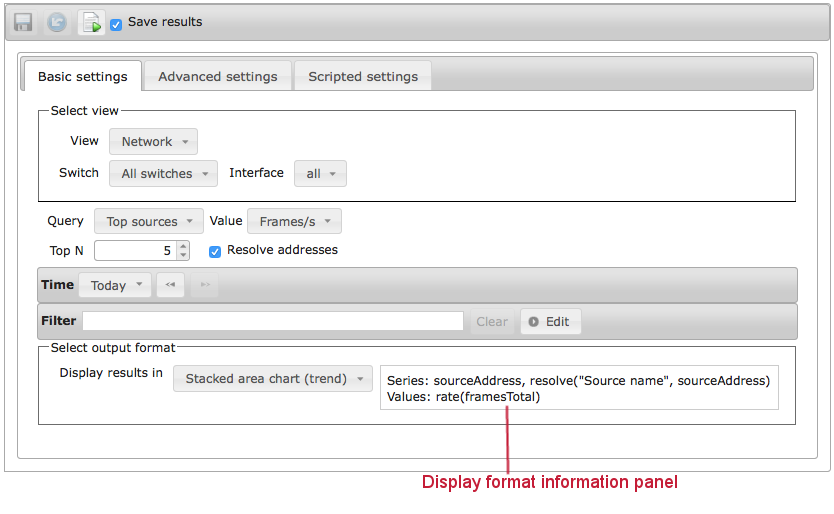
To define a query using Basic settings, first decide whether you are interested in network traffic data (use the View selector to select Network), host performance data (use the View selector to select Host), or service performance data (use the View selector to select Service).
If the query is focused on network traffic data, you can select whether the query should extract data for the whole network or for an individual switch or interface. If the query should extract data for the whole network, use the Switch selector to select All switches. In this case, even if a traffic flow crossed multiple switches, the flow will only be counted once - ie the query de-duplicates the data. If the query should extract data about traffic crossing an individual switch and/or interface, use the Switch and Interface selectors to select the switch and interface of interest.
If the query is focused on host performance, you can select whether the query should extract data for all hosts or an individual host using the Host selector.
If the query is focused on service performance, you can select whether the query should extract data about all hosts or an individual host using the Host selector. You can use the Service selector to select the service of interest.
The next step is to use the Query selector to choose a predefined query; you can think of this as selecting the key fields for the columns in the query results. You can then use the Value selector to specify the value field column for the results. Note that the network Utilization and Counters predefined queries are only available when a single interface is selected using the Switch view and Interface view selectors.
The next step is to parameterize the query:
- Top N
-
Specify how many rows there will be in the table. In general only a few contributors are responsible for the majority of the traffic or application transactions. Selecting a value for the top n results in data showing who those few contributors are. The Top N selector is not enabled when network Counters, or Utilization queries, host predefined queries, or service counters predefined queries are selected.
- Time
-
Select the time period for which the query will extract data. The time selector is described at Selecting a time period
. - Filter
-
Further refine the query by filtering on specific attributes of the traffic. Filtering is described at Filtering. Once you have fully parameterized the query, you can select how you would like the results to be displayed using the Display results in selector to select a display format. When you select a display format, sFlowTrend-Pro helps you understand how the data produced by the query will be displayed. For example, if you select Bar chart (totals), the display format information panel will show which fields will be used for the categories (bars) and the value field used to determine the height of the bar.
Editing a query using advanced settings
The Advanced settings tab allows you to define your own queries by manually selecting the key fields and value fields that the query should extract data for.
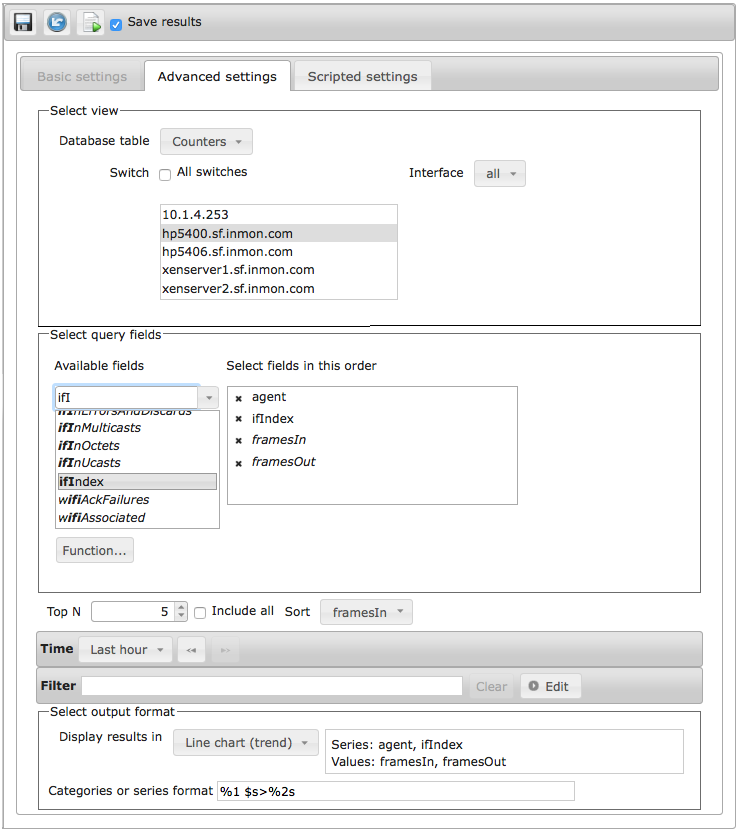
To define a query using Advanced settings, first select the database table that query should access. sFlowTrend-Pro includes three database tables:
- Counters
-
This database table includes data on the overall loading of each of the interfaces being monitored.
- Traffic
-
This database table includes data on the end hosts using the network and which protocols they are using.
- Host counters
-
This database table includes data on the performance of end hosts.
- Service counters
-
This database table includes data on the overall application performance.
- Services
-
This database table includes data on application transactions and their attributes. It can be used to understand the top contributors to application transaction volume.
If you have selected Counters or Traffic database table, you can then decide whether the query should extract data for the whole network or for specific switches or a specific interface. If the query should extract data for the whole network, check the All switches check box. If the query is to extract data for specific switches, then make sure that the All switches check box is not checked, then select one or multiple switches from the list of switches being monitored. If the query should extract data about traffic crossing an individual interface, select the switch for the interface, then use the Interface selector to select the interface of interest. If the query is defined to have a view with multiple switches, if a traffic flow crossed multiple switches, the flow will only be counted once — ie the query de-duplicates the data.
If you have selected the Host counters database table, you can then decide whether the query should extract data for all hosts or for specific hosts. If the query should extract data for all hosts, check the All hosts check box. If the query is to extract data for specific hosts, then make sure that the All hosts check box is not checked, then select one or multiple hosts from the list of hosts being monitored.
If you have selected the Service counters or Services database table, you can then decide whether the query should extract data for all hosts or for specific hosts. If the query should extract data for all hosts, check the All hosts check box. If the query is to extract data for specific hosts, then make sure that the All hosts check box is not checked, then select one or multiple hosts from the list of hosts being monitored. If the query should extract data about a specific service, then use the Service selector to select the service of interest.
The next step is to specify the fields for which the query should extract
data for.
The Select query fields panel allows you to select fields from
those available for the selected database.
The available fields are shown in the Available fields list,
with the value fields listed in italic.
If you want to display the results of the query in a chart, you must select
at least one value field.
The Available fields list includes a type in text field that allows
you to filter the available fields for fields whose names match the typed in
text.
For example, if you have selected the Traffic database, you can type
addr into the type in field to see only those fields which include addr
in their names.
The Allow nulls in keys checkbox allows you to specify whether the
query results can include flows with keys whose values are null.
For example if you create a query with macSource, ipSource
and framesTotal fields and check Allow nulls in keys, the
query results can include layer 2 only flows (eg layer 2 broadcasts, ARP). If
you do not check Allow nulls in keys, then the query results will
only include flows that have both a MAC layer and an IP layer.
You can also specify functions of fields. Functions are described at Database functions. Click the Function button to show a dialog that helps you build a function. Some functions may not be relevant for the selected database.
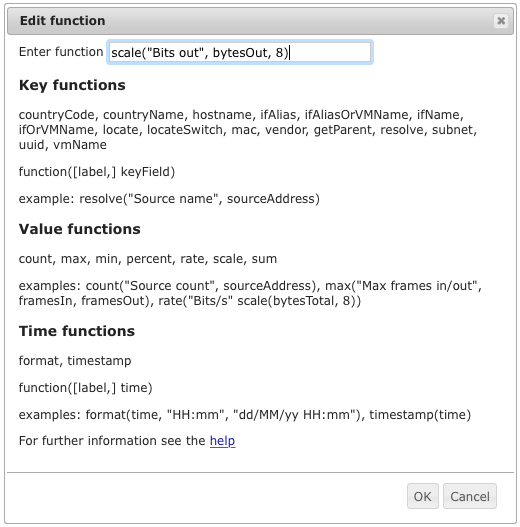
If you have selected at least one value field, you will have the option of selecting whether the query results should be sorted and which value the results should be sorted on. You can also specify the Top N, which will cause the query results to show only the top n entries when sorting on the specified value. You can also choose to see all the results by checking the Include all checkbox, this is only sensible if you choose to display the query results in a table.
As with the Basic settings, you can parameterize the query further
by selecting a time period for which data should be extracted (see Selecting a time period )
and a filter to select traffic that meets certain attributes (see Filtering).
The final step is to select the output format for the query results using the Display results in selector. Select a table or chart appropriate to the report you are creating.
The Category or series format field can be used to improve the
formatting of a chart.
This can be set to a string, using the syntax of the Java
Formatter
class.
Depending on the chart selected, a list of fields are used for the categories
or series in the chart.
The format string can combine the members of the list into a more human-readable
form.
Each item in the list of categories or series can be referenced in the format
string using %i$s, where i is the ith member of the list.
For example, if the series list is agent, ifIndex (as in the example), and a
format string %1$s>%2$s is used, then the series will be named agent>ifIndex.
If a format is not specified, then the series will be named using a comma
separated list (agent, ifIndex in the example).
It can be quite complicated to create a format string.
The basic approach is to consider that each item in the series or category list
will always be a string, and can be referenced using %1$s, %2$s, etc.
Other characters can then be used to combine these together in a meaningful way
(in the example above, the '>' character is used to separate the agent from the
ifIndex).
Editing a query using scripted settings
The Scripted settings tab allows you to define your own queries by manually specifying the key fields and value fields that the query should extract data for. Using a scripted query allows complete flexibility in the queries that can be run and charts generated. It is also possible to use the same set of data to create multiple output images in the report, for example a chart and a table of results. This technique can make reports faster to run with slow queries, since the query only has to be executed once. Scripted queries are written using the JavaScript language. This document does not describe the JavaScript language, however there are many good books and web sites on this topic. The user contributions area at the InMon Corp. customer portal (https://www.myinmon.com) can also be used for sharing example reports with other users.
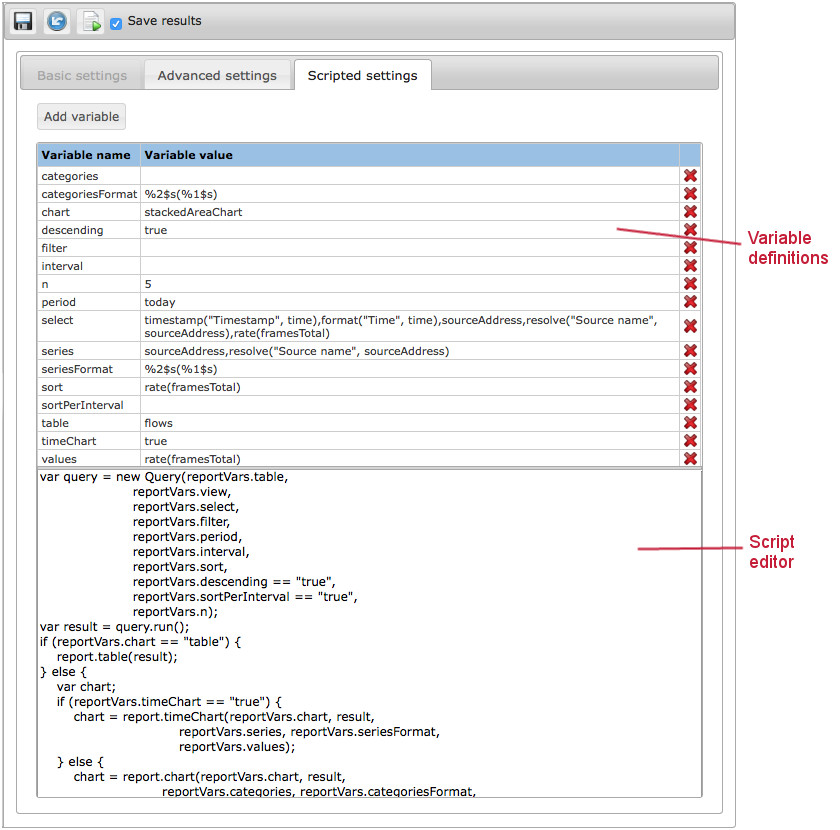
The Scripted settings tab is divided into two areas: variable definitions and the script editor.
Variable definitions allow a query to be parameterized (run with different settings)
without editing the script itself.
Instead, a variable definition is changed.
This mechanism is used by the basic and advanced query editors to specify the various
parameters of a query.
If you view a basic query within the scripted query editor (by selecting the
Scripted settings tab, you can see the variables used.
Variables can be changed by editing the name of the variable, or the value, within
the table.
A variable can be deleted by clicking , and new variables added
as required.
Any variables defined here can be accessed from the report script as properties of
the reportVars object.
The script editor is how the actual report script is entered. The script should be written in standard JavaScript, which can also include special classes defined by sFlowTrend-Pro. The normal flow of a report is to define the query required, to run the query to obtain a table of results, and finally to visualize the results using a chart or a table. A simple example of top sources is shown below:
var query = new Query("flows", "",
                      'timestamp("Timestamp", time), sourceAddress,\
                      resolve("Source name", sourceAddress), rate(framesTotal)',
                      "", "lastHour", 1, "rate(framesTotal)", true, false, 5);
var result = query.run();
report.timeChart("lineChart", result, "sourceAddress, resolve(sourceAddress)",
                 "%1$s(%2$s", "rate(framesTotal)");
Note that you have to take care with the use of single and double quotes, and use
the line continuation character \ to concatenate long strings which cover
multiple lines together.
In particular, any quotes that appear within database functions must be double quotes
(in the example above, we have used single quotes for the select string, to make it
easier to then use double quotes within the functions).
You can refer to Classes and objects defined within scripted reports for the reference of additional objects and classes defined within JavaScript to allow reports to be generated. Database fields reference is the reference of fields available from the database, and Database functions for the database functions that are available.
9.1.6. Editing an HTML section
When you select an HTML section in the reports browse pane, the report settings pane will display the settings for the HTML section. An HTML section can be used to provide formatted and unformatted content in the report. For example, if you would like to show a title and a description for a chart produced by a query section, you can insert an HTML section before the query section. You can then edit the settings for the HTML section as follows:
<h1>Top sources</h1>
<p>This chart displays top sources for today</p>
You can enter text or HTML formatted text in an HTML section.
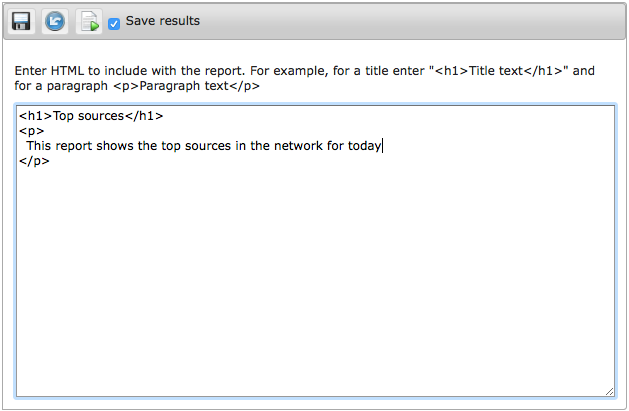
9.1.7. Running a report
To run a report definition, select the report definition, or any of its sections,
in the reports browse pane, then click the Run reports []
button in the report settings pane.
The results will be displayed in a separate window.
If you are an administrator you can also select to save the results of running the
report by checking the Save results checkbox .
If you have chosen to save results, then the report results will be available in the
report results table in the report settings pane when the report definition
is selected in the reports browse pane.
When you run a report definition, the settings that are currently showing will be used and not the saved settings.
9.2. Managing scheduled reports
The Scheduled reports sub-tab gives a tabular view of all the reports that
have been configured to run on a schedule.
The table includes a row for each scheduled report.
For each currently scheduled report, the table gives the current state of the report,
the schedule the report is running on (in cron syntax), when the report was last run
on the schedule, and how long it took to run.
The state of a scheduled will be shown as Time exceeded if, when the last time the report was run on the schedule, the configured Max run time was exceeded and the report run was cancelled automatically.
The state of a scheduled will be shown as Cancelled if, when the last time the
report was run on the schedule, the report was cancelled manually while it was running
(see Cancelling a running scheduled report ).
Clicking on the report name will take you to the Reports sub-tab with the report selected so you can easily view and edit the report definition and settings.
9.2.1. Cancelling a running scheduled report
When a report is being run on the configured schedule, the table will show the report
state as Running.
To cancel the running scheduled report, click on shown in the last
column of the row for the report.
10. Selecting a time period
sFlowTrend-Pro stores a history of network, host and application performance data (see Server custom configuration settings for information on configuring the length of history stored). The Time selector allows you to select the period in the history for which data is to be displayed. Since sFlowTrend stores one hour of data, the Time selector is not available and sFlowTrend always displays the last hour of data.
A time selection is defined by a start and end time, and, when data is
displayed as a trend over time, an interval size.
The interval size defines the granularity of the data displayed.
For example Tue 10 Apr, 2023 01:00 - Tue 10 Apr, 2023 05:59, Interval = 2 mins
defines a 6 hour time period, with data points for each 2 minute interval in the
time period.
There are two ways to make a time selection:
-
Using the Time selector (see Using the Time selector).
-
Dragging the mouse (see Making a time selection by dragging the mouse).
10.1. Using the Time selector
The Time selector includes the following, commonly used, time selections:
- Last hour
-
Last hour, with a data point for each 1 minute interval.
- Last 6 hours
-
Last 6 hours, with a data point for each 2 minute interval.
- Last 12 hours
-
Last 12 hours, with a data point for each 5 minute interval.
- Last 24 hours
-
Last 24 hours, with a data point for each 15 minute interval.
- Today
-
Today, with a data point for each 15 minute interval.
- Yesterday
-
Yesterday, with a data point for each 15 minute interval.
- This week
-
This week, with a data point for each 1 day interval.
- Last week
-
Last week, with a data point for each 1 day interval.
- Custom
-
Custom time selections see Using custom time selection.
| If the start time of the time selection is earlier than the start of the stored history, the start time will be adjusted to the start of the stored history. For example if sFlowTrend-Pro is configured to store 7 days of data and today is Friday 18 Dec 2015, then the earliest day for which there will be stored data will be Saturday 12 Dec 2015. In this case, when Last week is selected, the start time will be adjusted to Saturday 12 Dec, 2015 (rather than Sunday 29 Nov, 2015). |
The Time selector also includes back [] and
forward [] buttons that can be used to view data for
the previous or next time period.
For example if the time selection is Last 6 hours and the current time
is Mon 21 Dec 2015, 12:53, clicking on the back arrow will cause the previous
6 hours of data, ending at Mon 21 Dec 2015, 06:53, to be displayed (using the
Custom time selection).
The back and forward buttons will be inactive if the current time selection is
at the beginning or the end of the stored data.
When a non-custom time period is selected, the displayed chart will be updated automatically when the next data point is available, thus displaying a rolling window of data. The Progress indicator will show when the chart will next be updated.
When you choose a time selection which has an interval size greater than 1 minute, the Progress indicator will have two parts. The outer part will show progress through the current minute, whilst the inner part will show progress through the chosen interval (ie how long until the next data point will be available).
10.1.1. Using custom time selection
The Custom time selection gives full flexibility in accessing the stored historical data.
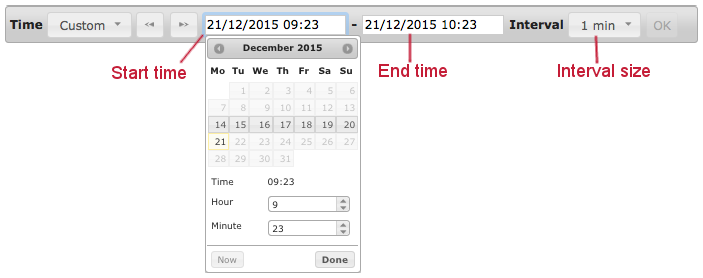
When you click on the start time or end time fields a calendar will be displayed. You can use the calendar or you can type directly into the fields to select the desired start and end time. The calendar indicates the days for which data is available. Click on the OK button to cause the chart for the selected time period to be displayed.
| The Time selector displays time in the server time zone. Similarly sFlowTrend-Pro always interprets a time period for a query in the server time zone and the resulting charts display the time period in the server time zone. |
| There is a maximum number of data points that can be displayed in a chart, so small interval size selections will not be available for long time period selections. |
When the Custom time selection is used, the charts are static and are not updated as more data becomes available.
10.2. Making a time selection by dragging the mouse
You can select a time interval to view in more detail by dragging the mouse over the chart. As you drag the mouse the time selection is shown by highlighting in the region in the chart. When you release the mouse, a new chart will be displayed for the Custom period between the chosen start and end times and using the smallest possible interval size (ie the most detailed data that can be displayed for the period). Since this new chart is using a Custom time selection, the new chart will be static and will not be updated as more data becomes available.
If you find that a mouse drag is detected when you intend to click on a bar to select a specific interval in a Top N chart, you can use the Control+Left mouse button (or on a Mac Command+Left mouse button) to select the bar.
11. Filtering
sFlowTrend-Pro allows the information displayed in a Top N network traffic or service chart (but not a counters chart) to be filtered. This allows you to focus on a subset of the data that may be of interest. For example, if you only wanted to look at web traffic, you could set a filter for only TCP port 80 traffic.
11.1. Basic use of filters
The filter is activated by clicking on the filter button
 (if you are currently viewing a counters
chart, then the filter button is not present). If the filter is active, then
the button is shown without a red line,
(if you are currently viewing a counters
chart, then the filter button is not present). If the filter is active, then
the button is shown without a red line,  , and
the filter bar is displayed.
If it is inactive, the button is drawn with a red line thought it, and the
filter bar removed.
The current filter can be activated and deactivated by repeatedly clicking the
button.
This does not remove the text of the filter in place, this makes it easy to see
the effect of filtering and not filtering your data.
, and
the filter bar is displayed.
If it is inactive, the button is drawn with a red line thought it, and the
filter bar removed.
The current filter can be activated and deactivated by repeatedly clicking the
button.
This does not remove the text of the filter in place, this makes it easy to see
the effect of filtering and not filtering your data.
Filters are created by entering the filter into the filter bar. The filter can be specified just by typing the appropriate expressions into the filter bar, or to make it easier you can use the filter builder.
To bring up the filter builder, click the Edit button at the right-hand end of the filter bar. The filter builder bar will appear below the filter bar.
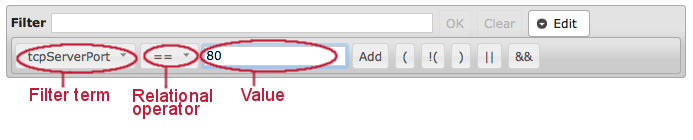
In the filter builder, you can select the term that you want to filter on, a
relational operator (eg == for equality), and a value.
For example, to filter on web traffic, you would select tcpServerPort
for the filter term, the equality operator, and enter 80 for the value.
Then, clicking on the Add button adds this expression to the filter.
You can combine many different expressions together, using logical operators
(|| for or, && for and).
For each expression you want to add to the filter, click the || or
&& button as appropriate (you can also use parenthesis to ensure the
correct order of evaluation), then select the expression you want and click
Add.
How you type the value to compare against depends on what type of term
you are comparing.
For entries such as TCP ports, which are integers, just type the number.
For MAC or IP addresses, the value must be surrounded by quotes: for example,
ipServer == "10.0.0.1".
Addresses and ports must be entered in their numeric form.
It is not possible currently to use a DNS name in the filter.
|
When the filter is complete, apply it by clicking the OK button at the
right of the filter bar.
The chart will be redrawn, using only data that matches the filter.
The current filter is displayed at the top of the chart, to remind you how
the data was filtered.
If there was an error in the filter, then instead of the chart an error message
will be displayed.
Sometimes, it can be difficult to understand the error messages.
Common errors are omitting quotes around an address, or using || or &&
with non-matching expressions.
When using the filter builder, you will notice that as the filter is constructed, it is entered into the filter bar. It is also possible to directly type into the filter bar. See Advanced use of filters for more information on the format of filters. For a list of the available items to filter on, and their meanings, see Terms available for use in filters.
11.2. Advanced use of filters
This section contains information on using JavaScript to construct custom filters, which allows very specific filtering.
Basic use of filters describes the basic use of filters. To use a filter, an expression is entered into the filter bar, which specifies what to filter on. The filter expression is actually interpreted in JavaScript, which allows the full power of JavaScript to be used to create a filter. The expression can take the form of a series of JavaScript statements, eg:
statement-1;
statement-2;
...
statement-n
Each of these statements is evaluated for each network traffic datapoint found.
The result used by the filter is the result of the final statement,
statement-n, which must be a boolean.
If the result is true, then the datapoint is passed by the filter,
and added to the chart.
If the result is false, then that datapoint is discarded.
If the final expression is not a boolean, then an error is indicated.
Note that the statements prior to the final one may have side effects, that
affect the result of the final statement.
The terms that can be referenced from the filter are listed in Terms available for use in filters. Any valid JavaScript boolean operator or function can be used to evaluate a term. This includes regular expressions, which allow more complex pattern matching than equality.
A common requirement, but one difficult to formulate in a filter, is testing
if an IP address is a member of a specific subnet.
To make this easier, a function is provided for this purpose:
inSubnet(address, subnet, maskBits).
This will return true if address is a member of subnet with a
mask of length maskBits. address can be any address field, or in fact any
string representing an IP address.
For example, to create a filter to retain only traffic from subnet
10.1.2.0/24, use this filter:
inSubnet(ipSource, "10.1.2.0", 24)More complex filters can be constructed; for example, if you wanted all traffic
from the above subnet going to another subnet 192.168.0.0/16, then you could
use:
inSubnet(ipSource, "10.1.2.0", 24) && inSubnet(ipDestination, "192.168.0.0", 16)Similarly to inSubnet, an address can be tested for falling within a range
of IP addresses, but where the range may not form a valid subnet.
For this, use the function inIPRange(address, rangeStart, rangeEnd).
This will return true if address is greater than or equal to
rangeStart and less than or equal to rangeEnd.
rangeStart and rangeEnd can be either IPv4 or IPv6 addresses (both must
be of the same version).
For example, to create a filter to retain only traffic sourced from 10.1.2.1
to 10.1.2.10, use the filter:
inIPRange(ipSource, "10.1.2.1", "10.1.2.10")11.3. Terms available for use in filters
Database fields reference describes the fields that can be used in filters. These fields must be formed into filter expressions, as described in Advanced use of filters. The table also specifies the type of each field. You should be careful to only combine fields of the correct type together, using the normal rules for JavaScript.
As noted in Database fields reference, only fields that are associated with the
database table (flows or counters) that the query is being run over can be
used.
In addition to constant fields, functions are also provided to help build filters. The functions available are described in Filter functions reference
12. End host information
sFlowTrend-Pro uses sFlow data to automatically discover the switch and interface
that connects an end host to the network.
You can access this location information, together with other useful information
about an end host by selecting the Lookup host menu item.
This opens the Lookup host dialog.
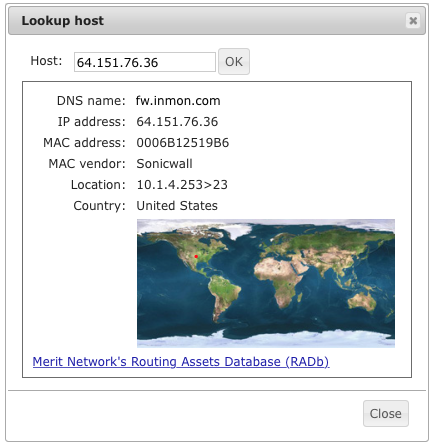
The Lookup host dialog includes the following fields:
- Host
-
Enter the IP address, MAC address or the DNS name of the end host for which information is required.
- DNS name
- MAC address
-
The MAC address for an IP address is discovered from the traffic monitored over the last hour. If an IP address has not been seen in the last hour, then the MAC address will not be displayed.
- MAC vendor
-
If the MAC address is displayed, then the MAC vendor code in the MAC address is used to look up the MAC vendor.
- Location
-
The location (switch and interface connecting the end host to the network), is discovered from traffic monitored over the last hour. The location is given in the form
Switch IP address>ifIndex. If the end host is not local then its location will be shown as the up link of the monitored switch or router closest to the border. If the end host has not been seen in the last hour, then the location will not be displayed. - Country
-
If the IP address for the end host is discovered, then it will be used to look up the country and indicate the country on the map. The country location for some IP address (for example local
10.*addresses) are unknown. - Merit Network’s Routing Assets Database (RADb)
-
Clicking on this link will open a browser to lookup the IP address in RADb. If the IP address is not shown, then this link will be inactive.
You can also access end host information directly from the Top N and
Circles charts by clicking on the symbol shown
next to end host addresses in the charts.
End host address mapping and location information can also be shown in reports by selecting the database key functions: countryCode, countryName, locate, mac, and vendor. See Key functions
13. Configuration
sFlowTrend-Pro is configured using the configuration menu, which is accessed using
the gears icon .
Depending on whether you are logged in as an administrator or not, different
options will be available in the menu.
13.1. User preferences
Selecting User preferences brings up the user preferences dialog.
This allows you to change the settings for the current user.
If you have created users in sFlowTrend-Pro (see Configuring user authentication ), then
changing the user preferences will apply for the current user wherever they are
logged in from.
If you have not created any users, then the new user preferences will apply
globally.
13.1.1. Setting the switch and interface naming policy
Use the Agent and interface naming pane to tell sFlowTrend-Pro how you would like your switches and their interfaces to be displayed.
Setting the switch naming policy
Switches can be displayed using one of the following options:
- SNMP IP address
-
The IP address that sFlowTrend-Pro uses to communicate with the switch via SNMP .
- sFlow agent address
-
The IP address that is used by the sFlow agent on the switch to uniquely identify the switch.
- DNS name
-
The domain name obtained from the reverse DNS lookup of the SNMP IP address of the switch. If the reverse DNS lookup fails, the SNMP IP address will be used instead.
- sysName
-
The SNMP sysName obtained from the SNMP MIB. If sFlowTrend-Pro cannot communicate with the switch using SNMP (see sFlowTrend-Pro cannot communicate with the switch using SNMP), then the SNMP IP address will be used instead. If the SNMP IP address or the sFlow agent address option is chosen, the switches will be listed in numerical order in the Switch selector in the Charts and Interfaces tabs. For other options, the switches will be listed in alpha-numeric order, even if an IP address is shown because the name is not available.
Setting the interface naming policy
Interfaces can be displayed using one of the following options:
- ifIndex
-
The integer that the switch uses to uniquely identify the interface.
- ifName
-
The friendly name assigned to the interface, identifying the card/slot. For example A1, ethernet1/1. If sFlowTrend-Pro cannot communicate with the switch using SNMP (see sFlowTrend-Pro cannot communicate with the switch using SNMP), then the ifIndex will be used instead.
- ifAlias
-
A string administratively assigned to the interface often giving useful information about its purpose. For example "Connection to servers". If sFlowTrend-Pro cannot communicate with the switch using SNMP (see sFlowTrend-Pro cannot communicate with the switch using SNMP), or the ifAlias is not assigned, then ifIndex will be used instead. If the ifIndex option is chosen, the interfaces will be listed in numerical order in the Interface selector in the Charts tab. For other options, the interfaces will be listed in alpha-numeric order, even if the ifIndex is shown because the name is not available.
13.1.2. Chart settings
The Chart settings pane allows you to change the appearance of charts in the Network and Thresholds tabs.
In the Network and Thresholds tabs, end hosts can be identified using IP addresses or DNS names. Check the Resolve IP addresses to hostname in charts checkbox to tell sFlowTrend-Pro to use DNS names instead of IP addresses. Note that even if the option to resolve IP addresses is selected, the unresolved address may be shown if sFlowTrend-Pro could not resolve the address, or if the DNS server is responding slowly. In the latter case, addresses will continue to be resolved in the background, and when the page is refreshed the resolved names may be displayed.
The Top N chart entries selector allows you to change the number of entries that are displayed in a top n chart. In the selected minute of the chart, this number of entries will be shown. If there are more entries than this then they are grouped together as Other.
Similarly, the number of protocols displayed in a circles chart can be changed using the Circles chart protocols selector.
13.1.3. Changing your password
If users have been created in sFlowTrend-Pro, you can change your password by filling in the current and new passwords into the Change password pane. The password is changed when OK is pressed on the dialog. If you don’t want to change your password when setting other preferences, just leave the current and new password fields blank.
13.1.4. Restore warnings
Checking the Restore warnings checkbox will cause sFlowTrend-Pro to display warnings asking you to confirm actions, for example when deleting switches or when exiting sFlowTrend-Pro. When these warnings are shown, you can ask sFlowTrend-Pro not to show these warnings again. This checkbox can be used to restore the behavior of showing warnings.
13.1.5. Show alerts
Leaving this checkbox checked will display alerts about sFlowTrend-Pro, such as notification of software updates. If you clear the checkbox, you will not receive any notifications. This may be useful if, for example, you are using sFlowTrend-Pro to display network status in a public area.
13.2. System configuration
Selecting System configuration allows several system-wide settings
to be configured.
The system configuration option will only be available if you are logged in as
an administrator.
13.2.1. General system configuration
Configuring the license
The license must be configured before using sFlowTrend-Pro. After installation, the license dialog will show automatically until the license is set, but you can also bring up license dialog using the Set license button on the General tab. You can also view the status of the license from the General tab.
From the license dialog, you can select to either use the free version of sFlowTrend, or use sFlowTrend-Pro. If you select Use sFlowTrend (free) then no license number is required. Just click OK to enable the free version. To use either the paid version or an evaluation license, you must enter the license details. Enter the license number (this starts with "SFT…" and is available from your account at https://www.myinmon.com) and then click OK. It is not necessary to enter the license key unless your system has no Internet access (see below).
If there is any problem with the license number you provided, this should be reported, allowing you to correct the problem. Otherwise, if the license is accepted, the dialog will close and sFlowTrend-Pro will continue with the new license.
sFlowTrend-Pro will use the license number entered to download the actual license key from the Internet. If the server requires a proxy connection for Internet access, please ensure that this is correctly configured (see Proxy configuration). If the system has no Internet connectivity at all, then the full license key can be entered manually. To get the key, please submit a support request at https://www.myinmon.com. Then paste in the key into the License key field on the license dialog, and click OK.
Reporting problems to InMon
The Report problems checkbox allows you to configure sFlowTrend-Pro to send information about any serious problems encountered by sFlowTrend-Pro back to InMon. Receiving these reports helps us improve sFlowTrend-Pro in future versions.
File location
All of sFlowTrend-Pro’s data is kept in one directory, which is displayed in the File location section. This location is sometimes needed for support requests, to ensure your data is backed up, or if you want to add specific customization or advanced configuration. To change the location, you must reinstall sFlowTrend-Pro.
13.2.2. sFlow configuration
The sFlow tab allows configuration of parameters required to make sFlow work correctly. Many users will not need to change the settings on this tab.
If the system you are running sFlowTrend-Pro on has multiple IP addresses and you are using SNMP to configure switches to send sFlow, you can use the sFlow collector address to set the address that is configured on the switches as the sFlow collector or receiver address. (see Adding a switch configured via SNMP). Note that sFlowTrend-Pro will listen for sFlow on all addresses, and unless you are using SNMP configuration this setting is not used.
If there is a NAT device between the system running sFlowTrend-Pro and the switches, or you are running sFlowTrend-Pro in a virtual or container environment where a virtual NAT device is used, you can use an advanced setting (see [advanced.configuration.natReceiverAddress]) to add the public IP address and port of the NAT device to the sFlow collector address option list. When you select the NAT address and port as the sFlow collector address and you are using SNMP to configure switches to send sFlow, the switches will be configured to send sFlow to the NAT address and port.
You can change the UDP port that sFlowTrend-Pro receives sFlow on using the sFlow UDP port selector. The default for this is the standard sFlow port of 6343, and should only be changed if your infrastructure requires a different port.
13.2.3. Configuring global SNMP settings
The global SNMP settings are configured using the SNMP tab. These settings are used when querying switches for the friendly names for the switches and interfaces. They are also used when sFlowTrend-Pro configures sFlow on a switch using SNMP; if this option is used, then the SNMP settings must allow write access to the sFlow MIB on the switch, and the switch must allow the system running sFlowTrend-Pro write access. You can ask sFlowTrend-Pro to communicate with the switches using SNMP v2c or SNMP v3.
SNMP v2c settings
When using SNMP v2c, enter the correct read community string. This will allow sFlowTrend-Pro to retrieve friendly names for the interfaces (ifName, ifAlias) and the sysName of the switch.
If sFlowTrend-Pro configures sFlow on a switch using SNMP, you must also enter the correct write community. The switch must also be configured to allow sFlowTrend-Pro write access to the sFlow MIB.
SNMP v3 settings
When using SNMP v3, enter the user name, authentication protocol and password, and privacy protocol and password which have been configured on the switches. These credentials must allow read access, in order for sFlowTrend-Pro to retrieve friendly names for the interfaces (ifName, ifAlias) and the sysName of the switches. If sFlowTrend-Pro configures sFlow on the switches using SNMP, then these credentials must allow write access to the sFlow MIB.
sFlowTrend-Pro supports SHA1 and MD5 authentication protocols and DES, AES128, AES192, and AES256 privacy protocols. Switch vendors use different algorithms to implement the key-extension required for AES192 and AES256. If your switch vendor implements the 3DES key-extension, choose either AES192(3DES) or AES256(3DES) for the privacy protocol, otherwise select AES192 or AES256.
These global settings can be explicitly overridden for a specific switch
(see Configuring agents in sFlowTrend-Pro ).
When these global settings are changed, sFlowTrend-Pro will start using the new settings to communicate with switches that use the global settings.
13.2.4. Proxy configuration
If a proxy server is required for the sFlowTrend-Pro server to have connectivity to the Internet, this is configured using the Proxy tab. It is important to set the proxies if required. The server uses Internet connectivity to download the initial license and any subsequent updates (for example, if you renew the license), and to download product notifications (eg notification of a new release).
The configuration available for the proxies is as follows:
- No proxy
-
No proxy will be used.
- Default system proxy
-
Sets the proxy to be the same as the system default. Note that the system default settings are not necessarily those defined in the browser that you use.
On some Operating Systems the system default setting is not available. In this case, please use the manual proxy configuration if a proxy is required.
- Manual proxy configuration
-
Allows configuration of a proxy server only for sFlowTrend-Pro. The address of the proxy server and the TCP port used to communicate with it should be entered into the Http proxy and port fields, respectively.
If there are any hosts that do not require a proxy, you can enter the address of these hosts into the Do not proxy for these hosts field. Multiple hosts can be entered here, separated by newlines, semicolons or commas, and wildcards can be used to represent a range of hosts (for example,
*.inmon.com).
13.2.5. Email
sFlowTrend-Pro uses a Simple Mail Transfer Protocol (SMTP) server to send email notification of events and to email scheduled report results. The SMTP server receives messages from sFlowTrend-Pro and forwards them to their destination. Before you can use email notification of events and configure emailing of scheduled report results, the following SMTP server settings must be configured:
- SMTP server
-
The hostname or IP address of the server that will receive messages from sFlowTrend-Pro for forwarding to their destinations (email recipients).
- Port
-
The TCP port on the SMTP server that sFlowTrend-Pro connects to to send email for forwarding.
- Sender
-
The full name of the user (for example sFlowTrend) that will be shown as the sender of emails sent by sFlowTrend-Pro.
- Address
-
The email address to be used as the From address in emails sent by sFlowTrend-Pro.
- Use authentication
-
Select authentication if your SMTP server will only receive and forward email from authenticated senders. If you select use authentication, then you must also enter the Username and Password that can be used to authenticate sFlowTrend-Pro as a valid sender.
- Encryption
-
The email encryption method (None, TLS, SSL). You can test the SMTP server configuration by clicking Test configuration. An email will be sent to the sender email address that you have entered. If the configuration fails, sFlowTrend-Pro will show an error message.
13.3. Configuring agents in sFlowTrend-Pro
An sFlow agent is responsible for sending sFlow data to sFlowTrend-Pro from a switch (or router) or a host. In the case of a switch or router, one agent will be associated with the device, and the IP address of the agent will normally be the same (or one of the) IP address used for the switch. Switches can be configured to send sFlow from sFlowTrend-Pro using SNMP, or alternatively the switch can be manually configured. For hosts, normally the agent runs on a physical host. This agent can send data for both that host, and any virtual machines that are running on that host. Hosts are configured to send sFlow either through DNS or manually.
Select the Configure agents menu item to launch the
Configure agents dialog.
This dialog contains a table which lists all the agents that sFlowTrend-Pro is
receiving sFlow from.
For switches, it also allows you to change the SNMP settings for each switch,
and to tell sFlowTrend-Pro about switches that it should configure via SNMP to send
sFlow.
The table includes the following columns:
- Status
-
This column uses color coded symbols to indicate the overall status of the agent:
 The agent is enabled and sFlowTrend-Pro is receiving sFlow
(and, if the agent is a switch or router, it can communicate with the switch
using SNMP).
The agent is enabled and sFlowTrend-Pro is receiving sFlow
(and, if the agent is a switch or router, it can communicate with the switch
using SNMP). The agent is disabled, but sFlowTrend-Pro is receiving
sFlow from it.
Or, if the agent is a switch, then either sFlowTrend-Pro is receiving CLI configured
sFlow from it, and sFlowTrend-Pro is unable to communicate with the switch via SNMP
to get the interface names, or sFlowTrend-Pro is still in the process of configuring
sFlow on the switch.
See sFlowTrend-Pro cannot communicate with the switch using SNMP.
The agent is disabled, but sFlowTrend-Pro is receiving
sFlow from it.
Or, if the agent is a switch, then either sFlowTrend-Pro is receiving CLI configured
sFlow from it, and sFlowTrend-Pro is unable to communicate with the switch via SNMP
to get the interface names, or sFlowTrend-Pro is still in the process of configuring
sFlow on the switch.
See sFlowTrend-Pro cannot communicate with the switch using SNMP. The agent is enabled, but sFlowTrend-Pro is not receiving
sFlow.
If the agent is a switch, then this can also mean sFlowTrend-Pro cannot communicate
with the switch using SNMP to enable it.
See sFlowTrend-Pro is not receiving sFlow from a switch or host and
sFlowTrend-Pro cannot communicate with the switch using SNMP.
The agent is enabled, but sFlowTrend-Pro is not receiving
sFlow.
If the agent is a switch, then this can also mean sFlowTrend-Pro cannot communicate
with the switch using SNMP to enable it.
See sFlowTrend-Pro is not receiving sFlow from a switch or host and
sFlowTrend-Pro cannot communicate with the switch using SNMP. The agent is disabled and sFlowTrend-Pro is not receiving
sFlow from it.
The agent is disabled and sFlowTrend-Pro is not receiving
sFlow from it. A switch setting has been changed in the
Configure agents dialog, but the change has not been deployed
(operation pending). sFlowTrend-Pro will deploy the change when you click the
OK button.
A switch setting has been changed in the
Configure agents dialog, but the change has not been deployed
(operation pending). sFlowTrend-Pro will deploy the change when you click the
OK button.The tooltip for the status symbol gives more detail on the status of the agent.
- Type
-
The type column displays the type of agent: whether it is a switch or a host:
 The agent is a switch or router.
 The agent is a host.
 The agent is both a switch/router and a host.
 - DNS name
-
The domain name obtained from the reverse DNS lookup of the SNMP IP address of the agent.
- SNMP IP address
-
The IP address that sFlowTrend-Pro will use to communicate with the agent, if it is a switch, via SNMP to obtain the friendly system and interface names. This is also the IP address that sFlowTrend-Pro will use when using SNMP to configure the switch to send sFlow, if Configure via SNMP is selected.
- sFlow agent address
-
The IP address that is used by the sFlow agent to uniquely identify itself. This address is learnt from the sFlow data and cannot be changed in sFlowTrend-Pro. For a switch, in many cases the sFlow agent address will be the same as the SNMP IP address. However if the switch is switching between multiple VLANs, the sFlow agent address may be in a VLAN that is not routable to the host that is running sFlowTrend-Pro. If this is the case you can change the SNMP IP address to tell sFlowTrend-Pro how to communicate with the switch.
- Enable
-
Check this checkbox if you would like sFlowTrend-Pro to receive and store data for this agent. You can use the checkbox in the title row for the header to enable or disable all agents.
- Configure sFlow via SNMP
-
For a switch, check this checkbox if you would like sFlowTrend-Pro to use SNMP to configure the switch to send sFlow.
- Use global SNMP settings
-
For a switch, check this box if you would like sFlowTrend-Pro to use the global SNMP settings (see Configuring global SNMP settings) when communicating with the switch using SNMP. If this box is not checked you can specify the SNMP settings for this switch by clicking on the
button. sFlowTrend-Pro uses SNMP to query the switch
for the systemGroup and ifTable, so that it can present friendly names for the
switch and its interfaces.
If sFlowTrend-Pro is to use SNMP to configure the switch to send sFlow, these
settings must allow write access to the sFlow MIB. - Edit
-
Although most of the commonly changed agent settings can be edited in the table, for a switch you can edit all the settings and view the detailed status of the switch by clicking on this button. For example, if you want to configure switch specific SNMP settings, click this button and enter the correct settings (see SNMP v2c settings and SNMP v3 settings).
- Delete
-
Delete the agent from the sFlowTrend-Pro and stop further data collection. If this agent has been configured by SNMP to send sFlow, sFlowTrend-Pro will disable sFlow before deleting the switch. You can click with the Left mouse button on a column heading to sort the table by that column. You can also click with the Shift+Left mouse button to add secondary sort columns.
Any changes made to agents and their settings will not be implemented until the OK button is clicked.
13.3.1. Adding a switch configured via SNMP
Clicking on the Add switch agent button launches a dialog that allows you to enter the details for a new switch. This should be used when you wish to tell sFlowTrend-Pro about a switch that should be configured via SNMP to send sFlow. Enter the following information:
- SNMP IP address
-
The IP address that sFlowTrend-Pro should use when communicating with the switch via SNMP.
- Use global SNMP settings
-
Check this box if you would like sFlowTrend-Pro to use the global SNMP settings (see Configuring global SNMP settings). If this box is unchecked, you can click on Change SNMP settings to specify the SNMP settings specific to this switch. You can ask sFlowTrend-Pro to communicate with the switch using SNMP v2c or v3 (see SNMP v2c settings and SNMP v3 settings). Make sure that the SNMP settings that you enter will allow sFlowTrend-Pro write access to the sFlow MIB.
- Enable
-
Check this box if you want sFlowTrend-Pro to enable and start collecting data from this switch. sFlowTrend allows data to be collected from only five switches, so if five switches are already enabled, the Enable checkbox will be inactive and you must disable one of the other switches before you can enable the new switch.
- Configure sFlow via SNMP
-
Check this box if sFlowTrend-Pro is to use SNMP to configure the switch to send sFlow.
sFlowTrend-Pro will not configure the switch until the Configure agents dialog has been closed by clicking the OK button.
13.3.2. Verifying switch configuration and status
Once you have submitted the changes that you have made in the Configure agents dialog, by clicking the OK button, when you go to the Network, Interfaces, Counters, Top N, Circles, or Root cause tabs and select a switch, the sFlowTrend-Pro status bar (see Introducing sFlowTrend-Pro) will show the status of the switch that is currently selected. The message in the status bar will give information on whether sFlowTrend-Pro can communicate with the selected switch using SNMP, has successfully used SNMP to configure the selected switch to send sFlow (if this option has been chosen), and whether sFlowTrend-Pro is receiving sFlow from the selected switch.
You can also view the status of a switch by selecting the
Configure agents menu item to launch the Configure agents
dialog, and then viewing the tooltip for the color coded switch status symbol
or using the edit button to view the detailed status of a
switch (see above).
The status message will also indicate if there is a problem with the configuration, for example:
- No SNMP
-
sFlowTrend-Pro cannot communicate with the switch using SNMP. Verify that the sFlowTrend-Pro is using the correct SNMP settings and that there are no firewalls in the network or on the host that are blocking SNMP. See sFlowTrend-Pro cannot communicate with the switch using SNMP for troubleshooting tips.
- Cannot configure sFlow with SNMP - SNMP write access denied
-
sFlowTrend-Pro is not using the correct SNMP settings that allow write access to the sFlow MIB or the switch is not configured to allow SNMP set from the system running sFlowTrend-Pro.
- Cannot configure sFlow with SNMP - no sFlow MIB
-
The switch cannot be configured via SNMP to send sFlow. Instead, you must use the switch CLI to configure sFlow (see Configuring switches to send sFlow).
- Already in use
-
Another application has already configured this switch to send sFlow and there are no additional resources to send sFlow to sFlowTrend-Pro as well. Disable the other application so that the switch can be configured by sFlowTrend-Pro. You can identify the other applications which have already configured the switch by using the edit
button.
The Additional switch details section, under Other owners
lists the IP addresses of the other systems which have configured the switch,
together with a description of the application.
Alternatively, you can configure sFlowTrend-Pro so that it removes the other
application’s claim on the switch and replaces it with its own
(see Server custom configuration settings, sflowtrend.useForce).
13.4. Configuring user authentication
You can control which users have access to sFlowTrend-Pro by using the user
authentication feature of sFlowTrend-Pro.
User authentication is configured via the Manage users menu item,
which launches the Manage users dialog.
This dialog contains a table which lists all the configured users and allows you
to add users, change the password and role for a user, and delete users.
By default, there are no users configured in sFlowTrend-Pro and user authentication is disabled. This means that any user can use sFlowTrend-Pro and will have all the permissions associated with the Administrator role.
Once you have added at least one user, user authentication is enabled and any user wishing to connect to sFlowTrend-Pro must login with a configured user login name and password.
13.4.1. Adding a user
Clicking on the Add user button, launches a dialog that allows you to enter the details for a new user:
- Login
-
The user login name for the user.
- User
-
The full name for the user.
- Password
-
The password for the user. You must enter the same password in the Confirm password field.
- Role
-
The role that the user should be assigned. sFlowTrend-Pro includes three roles:
- Guest
-
Users with this role can access the traffic data.
- User
-
Users with this role can access the traffic data, set their own preferences, and change their own password.
- Administrator
-
Users with this role can access all the traffic data, configure switches in sFlowTrend-Pro (see Configuring agents in sFlowTrend-Pro
), manage users, and change system
related settings (see System configuration ).
Administrators can also add, remove, and edit reports, schedule reports to be
run automatically, and save report results when running a report manually.
|
If you decide to enable user authentication, then you must always
configure at least one user who is an Administrator.
This means that the first user that you add, must be an Administrator.
In addition if you use the edit After having configured user authentication, if you decide to allow uncontrolled user access, you can do so by deleting the file users.json in the sFlowTrend-Pro server home directory and restarting the sFlowTrend-Pro service. |
13.5. Configuring subnets in sFlowTrend-Pro
Select the Configure subnets menu item to launch the
Configure subnets dialog.
This dialog allows you to tell sFlowTrend-Pro about how end host IP addresses should
be grouped together.
Grouping end host addresses allows you to understand traffic patterns better.
For example, identifying end host addresses for each department, allows you to
view traffic between departments; understanding network traffic in this way,
allows you to make accurate capacity planning decisions and help enforce usage
policies.
sFlowTrend-Pro uses Classless Inter-domain Routing (CIDR) as the method to define
groups of addresses.
In CIDR notation a group of IP addresses is defined using a network (IP) address
and a number of mask bits indicating the number of significant bits from the
address that will be shared by members of the group.
For example, the CIDR 10.1.4.0/24 will group all the addresses that share the
10.1.4 prefix; ie all the addresses that exist on the 10.1.4.0/255.255.255.0
subnet.
sFlowTrend-Pro supports the CIDR notation for grouping IPv4 and IPv6 addresses.
To illustrate CIDR priorities, consider the an IP address, 10.1.4.1.
Suppose that two CIDRs are defined, 10.1.4.0/24 and 10.0.0.0/8.
The IP address is contained in both of these CIDRs, but the CIDR 10.1.4.0/24
is a more specific group of addresses and so will have priority over the
10.0.0.0/8 CIDR.
CIDRs provide a very efficient means of specifying address groups. The goal is not to reflect every detailed subnet in the network, but to use CIDRs to describe the overall subnetting policy for the site.
The following example gives a typical subnet configuration:
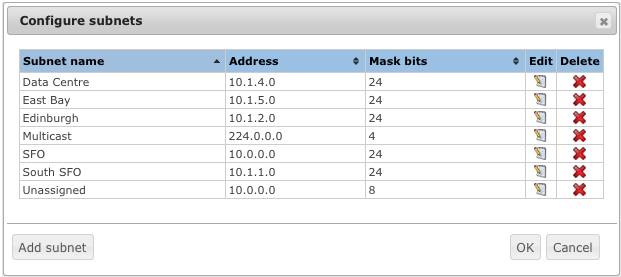
In this example we have added a special subnet for Multicast.
We have also added a "catch all" subnet, called "Unassigned". Remember that an
address will be assigned to the most specific CIDR, so the only addresses that
will be shown in the Unassigned subnet will be local addresses that don’t
belong in any of the other subnets.
Configuring a "catch all" subnet in this way, allows you to distinguish between
internal and external addresses.
Configure subnets dialog allows you to add new subnets and edit and
delete existing subnets.
To edit an existing subnet, click on the edit symbol, , for the
row representing the subnet.
To delete an existing subnet, click on the delete symbol, ,
for the row representing the subnet.
The dialog will prevent you from adding or editing subnets if the add or edit
would result in duplicate names or CIDRs.
13.6. Configuring action on events in sFlowTrend-Pro
Select the Configure events menu item to launch the
Configure events dialog.
This dialog allows you to configure automatic actions when sFlowTrend-Pro raises an
event.
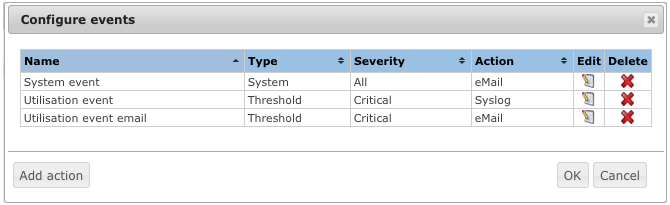
The Edit action on event dialog allows you to add new actions by
clicking on the Add action button and edit an existing action, by
clicking on the edit symbol, .
When you add or edit an action the Edit action on event dialog is
displayed.
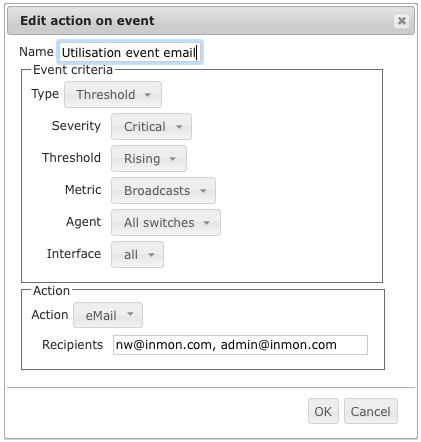
This dialog allows you to specify a specific action when certain event criteria are met.
To configure the event criteria, first select an event Type. You can select All, Threshold, System or Scheduled report event types. Once you have selected an event type, you can then select other criteria specific to that type. For all event types, you can select the event Severity when an action will be performed. For the Threshold event type you can select additional event criteria, specific to threshold events. Similarly, for Scheduled report events there are specific criteria that you can select.
To configure the action to be taken when event criteria are met, select an Action type. When you select the Email action, events meeting the criteria will be sent in an email to the Recipients that you specify. You can specify a number of email recipients by entering a comma separated list of email addresses. For sFlowTrend-Pro to be able to send events via email, you must first configure the email SMTP server (see Email). When you select the Syslog action, events meeting the criteria will be exported to the specified syslog server using the specified UDP Port to connect to the syslog server and the specified Facility to indicate the source of the event. sFlowTrend-Pro uses the event severity as the syslog message priority severity level indicator. See https://tools.ietf.org/html/rfc3164 for more information on syslog.
If sFlowTrend-Pro generates a large number of events, this will cause a large number of actions with matching criteria to be run. This may be inconvenient: for example, if a network suddenly became very busy, and you have an email action enabled for threshold events on all interfaces, then you would receive a very large number of email messages (one per interface exceeding the threshold). To minimize this, it is recommended that you configure event actions carefully, only selecting event criteria that are important to you. sFlowTrend-Pro will also try to minimize event action storms. If more than a predefined number of actions are queued for processing (eg email messages queued to be sent), then further actions of that type will be suppressed. An additional event will be logged informing you that event action suppression has taken place. Once the pending actions are processed, then new ones will again be accepted. This suppression threshold can be configured (see server custom configuration settings [advanced.configuration.event.emailThreshold] and [advanced.configuration.event.syslogThreshold]).
13.7. Checking for updates
If you have enabled client notifications, and the system you are running
sFlowTrend-Pro on has Internet connectivity, then you should receive a notification
when a new version of sFlowTrend-Pro is available.
You can also check manually for updates using the Check for updates
menu item.
14. Troubleshooting and frequently asked questions
14.1. Troubleshooting sFlowTrend-Pro
14.1.1. Installation problems
sFlowTrend-Pro requires the Java Run-time Environment (JRE) v11
sFlowTrend-Pro is written in Java, and needs a minimum of Java version 11 (or later). Java must be installed before installing sFlowTrend-Pro. Also, in the case of other installation problems, it is often easiest just to re-install the Java JRE.
The JRE is available from https://www.java.com.
14.1.2. No switches are listed in the Switch selector
If there are no switches listed in the Switch selector in the
Network and Threshold tabs, all the charts in the
Dashboard tab show No data, and the received sample rate on
the dashboard is 0, then sFlowTrend-Pro is not receiving sFlow data.
The Status bar will also show Configure switches/routers to monitor.
You must first configure your switches to send sFlow, see Configuring switches to send sFlow. If there are still no switches listed see sFlowTrend-Pro is not receiving sFlow from a switch or host.
14.1.3. When I select a switch in the Network, Top N tab, the chart is blank
If you select a switch using the Switch selector in the Network Top N tab and the chart is blank, sFlowTrend-Pro has not received sFlow data that matches the criteria specified by the current settings in the Top N tab.
-
If the Interface selector does not include individual interfaces, sFlowTrend-Pro is not receiving sFlow data from the switch. First ensure that the selected switch is enabled (see Selecting a switch. If the switch is enabled see sFlowTrend-Pro is not receiving sFlow from a switch or host.
-
If there are interfaces listed in the Interface selector, sFlowTrend-Pro has received sFlow data from the switch, but possibly not for the combination of the currently selected interface, chart, time, and filter. First make sure that the selected switch is enabled so that the Status bar indicates that the switch is not disabled (see Configuring agents in sFlowTrend-Pro
).
Then change the settings in the control bar as follows:-
Charts: Top sources
-
Interfaces: All (this selection is only available if you are viewing a top N traffic trend chart).
-
Time: Last hour
. -
Filter is disabled
.
For more information on settings in the Network tab see Network.
Now wait for the Progress indicator to reach 100%.
If the Top sources chart is still not showing data, then sFlowTrend-Pro is not receiving sFlow from the switch, see sFlowTrend-Pro is not receiving sFlow from a switch or host.
If you are now seeing data in the Top sources chart, sFlowTrend-Pro is receiving sFlow data from the switch. To understand which interfaces are reporting on traffic, change to the Interfaces tab and click on the Unicasts/s column heading until the table is sorted so that rows are listed with the interface showing the highest unicasts/s listed first. If there are interfaces listed in table but there are no counter values, wait for the Progress indicator to reach 100% again (see Interfaces for more information on the Interfaces tab). Then click on the chart
button associated with first row.
You will now be taken to the Counters tab with the interface with the
most unicast/s selected. -
14.1.4. When I select a switch in the Network Interfaces tab, the table is empty
If you select a switch using the Switch selector in the Network Interfaces tab and the table remains empty even after the Progress indicator has reached 100%, sFlowTrend-Pro is not receiving sFlow from that switch.
If Status bar message indicates that the switch is disabled, enable the switch
(see Configuring agents in sFlowTrend-Pro ).
If the switch is enabled, then see sFlowTrend-Pro is not receiving sFlow from a switch or host.
14.1.5. When I select a switch in the Network Interfaces tab, the table rows have no counter values.
If you select a switch using the Switch selector in the
Network Interfaces tab and the table includes rows for the
interfaces but the interface counter columns show - even after the Progress
indicator has reached 100%, twice, sFlowTrend-Pro is receiving sFlow from the
switch but the sFlow data does not include interface counters.
Check that the switch is configured to export interface counters (see
Configuring switches to send sFlow).
14.1.6. sFlowTrend-Pro is not receiving sFlow from a switch or host
If the switch has been configured using the CLI to send sFlow, follow the steps below:
-
Ensure that the switch is using the correct IP address and UDP port used by the host running sFlowTrend-Pro. To view and configure the IP address and UDP port used by sFlowTrend-Pro see sFlow configuration.
-
Ensure that there are no host or network firewalls between the switch and sFlowTrend-Pro that are blocking the sFlow packets.
-
There may be insufficient traffic flowing through the switch for sFlow packets to be generated using the currently configured sampling rate. Try configuring the switch to sample more frequently. See Recommended sampling rates for recommended sampling rates.
If the host is running the sFlow agent, follow the steps below:
-
Ensure that the host is using the correct IP address and UDP port used by the host running sFlowTrend-Pro. To view and configure the IP address and UDP port used by sFlowTrend-Pro see sFlow configuration.
-
Ensure that there are no host or network firewalls between the host and sFlowTrend-Pro that are blocking the sFlow packets.
-
Check that the sFlow agent is running on the host. For more information on configuring the host agent, see Configuring hosts to send sFlow.
If sFlowTrend-Pro is to use SNMP to configure the switch to send sFlow, follow the steps below:
-
Make sure that the switch has been added to sFlowTrend-Pro, see Adding a switch configured via SNMP and that the correct SNMP v2 or SNMP v3 settings, which allow write access to the sFlow MIB, have been specified. Some additional configuration of the switch may be necessary to allow it to accept SNMP sets from the host running sFlowTrend-Pro, for example, see Configuring ProCurve switches to allow sFlow configuration via SNMP.
-
Use
Configure agents and view the status details for the switch
either by moving the mouse over the status color indicator to activate the
tooltip or by clicking on the edit button.
If the status indicates that the switch is not sending sFlow use the
additional status message to identify the problem:- No SNMP
-
sFlowTrend-Pro cannot communicate with the switch using SNMP. Verify that the sFlowTrend-Pro is using the correct SNMP v2 or SNMP v3 settings and that there are no firewalls in the network or on the host that are blocking SNMP. See sFlowTrend-Pro cannot communicate with the switch using SNMP for more diagnostics.
- Cannot configure sFlow with SNMP - SNMP write access denied
-
sFlowTrend-Pro is not using the correct SNMP v2 read/write community or SNMP v3 settings or the switch is not configured to allow SNMP set from the system running sFlowTrend-Pro.
- Cannot configure sFlow with SNMP - no sFlow MIB
-
The switch cannot be configured via SNMP to send sFlow. Instead, you must use the switch CLI to configure sFlow (see Configuring switches to send sFlow).
- Already in use
-
Another application has already configured this switch to send sFlow and there are no additional resources to send sFlow to sFlowTrend-Pro as well. Disable the other application so that the switch can be configured by sFlowTrend-Pro. You can identify the other applications which have already configured the switch by using the edit
button.
The Additional switch details section, under Other owners
lists the IP addresses of the other systems which have configured the switch,
together with a description of the application.
Alternatively, you can configure sFlowTrend-Pro so that it removes the other
application’s claim on the switch and replaces it with its own
(see Server custom configuration settings, sflowtrend.useForce).
-
If the status indicates that sFlow has been successfully configured, there may be insufficient traffic flowing through the switch for sFlow packets to be generated using the currently configured sampling rate. Try changing the sFlowTrend-Pro configuration so that the switch to is configured to sample more frequently (see Server custom configuration settings).
14.1.7. sFlowTrend-Pro cannot communicate with the switch using SNMP
If sFlowTrend-Pro cannot communicate with the switch using SNMP, the status bar shown when you go to the Network, sub-tabs and select a switch, will include No SNMP. In this case, sFlowTrend-Pro will be unable to display friendly names for the switch and its interfaces. It will also be unable to use SNMP to configure the switch to send sFlow. Verify that the that the sFlowTrend-Pro is using the correct SNMP settings and that there are no firewalls in the network or on the host that are blocking SNMP.
More diagnostics are available by using the Configure agents menu
item and viewing the status details for the switch, either by moving the mouse
over the status color indicator to activate the tooltip, or by clicking on the
edit button.
For example:
-
Timed out indicates that the SNMP v2 community is incorrect or there are firewalls in the network or on the host blocking SNMP.
-
Cannot decode response, Decryption failed, and User has no access privileges, indicate that the SNMP v3 settings being used by sFlowTrend-Pro do not match those configured on the switch. Check that the authentication and privacy passwords are correct, that the correct authentication protocol is being used, and that the user has appropriate access privileges.
The sFlowTrend-Pro log file in the sFlowTrend-Pro server home directory (see General system configuration) may give additional details.
14.2. Frequently asked questions
This page contains answers to some frequently asked questions when running sFlowTrend-Pro.
14.2.1. After I select a switch to monitor, why does nothing happen?
The dashboard (Status) displays the current sFlow sample rate
being received by sFlowTrend-Pro.
If this shows a sample rate of 0, then no samples are being received.
This can happen because no switch is configured to send sFlow, because there is
insufficient network traffic on the switch to generate any sFlow, or because a
firewall is blocking the sFlow data.
First, make sure that a switch is configured to send sFlow to sFlowTrend-Pro.
With some switches, this can be done automatically, using sFlowTrend-Pro.
Use the Configure agents menu, and then Add switch agent.
For other switches, sFlow must be configured through the switch’s command line
interface - refer to the manual for the switch.
See also Using the switch CLI to configure sFlow.
If you think that sFlow is configured correctly, then try to ensure that sufficient network traffic is flowing through the switch. See sFlowTrend-Pro is not receiving sFlow from a switch or host.
sFlow works by sending network packets to an sFlow collector, in this case
sFlowTrend-Pro.
The network packets are sent using UDP, on port 6343.
If a firewall, either on the system running sFlowTrend-Pro or in the network, is
blocking port 6343, then no sFlow data will reach sFlowTrend-Pro.
Make sure that both the firewall on the system and all network firewall are
allowing sFlow data through — see What firewall requirements does sFlowTrend-Pro have? for more
information.
14.2.2. When I start sFlowTrend-Pro, why do I get an error message "Cannot open UDP port 6343"?
This error message almost always means that another application is already using the default sFlow port, which is UDP 6343. A port can be used by only one application. If you try to run sFlowTrend-Pro more than once on the same system or another sFlow collector is already running on the same system, then you will see this error. Examples of other sFlow collectors are InMon Traffic Sentinel, a switch vendor’s element manager, or one of the other sFlow applications available.
To find out which application is already using the sFlow port, follow these instructions:
-
On Microsoft Windows, in a command prompt window, run the command:
netstat -p udp -a -bThis command takes a while to run. When it has completed, in the output look for a line like the following, containing 6343:
  UDP  PCNAME:6343     *:*           2428
 [javaw.exe]
This is saying that the program javaw.exe is using port 6343. Any Java application will appear as javaw.exe on Microsoft Windows, or if the application is not written in Java, then the name of the application will be shown. The number at the right (2428 in this case) is the process ID of the application.
-
On Linux, from a terminal window, run the command:
netstat -l -p -u | grep sflowThis should produce a (long) line like:
udp 0 0 *:sflow *:* 26680/javaThe very last part of this line is telling us that the process with ID 26680 is running java, using port 6343. Again, if the application using the port is not written in Java, then the name of the program would be shown here.
Once you have identified which application is using the sFlow port, you can decide which application to run at any one time, or you can change the port that sFlowTrend-Pro uses, by entering a new port number in the dialog.
| If you change the port that sFlowTrend-Pro uses and your switches are configured using SNMP to send sFlow (see Using SNMP to configure the switch to send sFlow), sFlowTrend-Pro will automatically reconfigure your switches to send sFlow to the new port. However, if your switches are configured via the CLI to send sFlow and you change the port used by sFlowTrend-Pro, you must also manually reconfigure your switches to send sFlow to the new port (see Using the switch CLI to configure sFlow). |
Occasionally, a host firewall can also cause this error message. If you could not find another program using the sFlow port, then refer to the section on firewalls: What firewall requirements does sFlowTrend-Pro have?.
14.2.3. Why are most of the bars in a Top N chart colored grey?
The grey part of a bar in a Top N chart indicates that the activity was from contributors not in the top N for the currently selected interval. See Understanding the Top N traffic chart or Understanding the Top N services chart.
14.2.4. What firewall requirements does sFlowTrend-Pro have?
sFlowTrend-Pro requires two network ports be available through all host or network firewalls between it and monitored switches, for the following purposes:
-
Reception of sFlow data. Without sFlow connectivity, sFlowTrend-Pro will not show any data. By default, sFlow uses UDP port 6343 (this can be changed if required — see sFlow configuration). Only reception of sFlow traffic is required, sFlowTrend-Pro will never generate any sFlow traffic.
-
SNMP connectivity between sFlowTrend-Pro and the monitored switches. This is strictly not required, but without it sFlowTrend-Pro will not be able to display friendly names for interfaces, and other similar features.
Also required is connectivity to a DNS server (to allow reverse IP address lookup), and http connectivity to the Internet (for license and product alert information; a proxy can be configured if required, and a license key manually entered if no Internet connectivity is available). There must also be connectivity over the web server ports between the client system and server (TCP ports 8087 and 8443 by default).
If the server running sFlowTrend-Pro has a host firewall, then this must allow sFlowTrend-Pro to access these ports. The firewall must allow the service connectivity, which may be different from the currently logged in user. Under Windows, the service runs as user Administrator.
14.2.5. How do I change the time for which sFlowTrend-Pro stores data?
By default, sFlowTrend-Pro stores the last 7 days' of data.
If required, this can be changed using the server custom configuration
setting [advanced.configuration.server.history].
15. Advanced topics
This section contains information on advanced topics, which many users will not be concerned about.
15.1. Server custom configuration settings
Some custom sFlowTrend-Pro server configuration is possible through the sFlowTrend-Pro properties file. Modifying this is only recommended for advanced users. The file must be edited using a standard text editor, and sFlowTrend-Pro service must be restarted before any of the changes will take effect. Changes to the configuration will affect all users using the server.
The properties file is called config.prp, and it is located in the
sFlowTrend-Pro home directory (which can be identified through the sFlowTrend-Pro
System configuration menu, General tab,
File location).
If the config.prp file does not exist in the directory, then create the file first. The file is organized as a series of lines, where each line is of the form:
propertyName = valueFor example,
database.hoursPersistent = 336would change the number of hours of data stored in the database to 336 (2 weeks). Note that all properties and values must be entered exactly as specified. Some of the properties that can be modified using the properties file are:
- database.hoursPersistent
-
Controls how many hours of data will be stored in the database, before being flushed. This number can be reduced from the default of 168 (1 week), if the database is getting too large.
- event.threshold.email
-
Sets the number of queued email event actions when email suppression will be enabled. The default value is 3, and a value of 0 switches off suppression of event email messages.
- event.threshold.syslog
-
Sets the number of queued syslog event actions when syslog suppression will be enabled. The default value is 5, and a value of 0 switches off suppression of event syslog messages.
- sflowtrend.autoEnable
-
The default value for this setting is
true. In this case, sFlowTrend-Pro will automatically enable and start collecting data from the firstnswitches that it receives unsolicited (command line configured) sFlow from, wherenis the maximum number of switches allowed by the software license. To control manually which switches are enabled, set this value tofalse.
- sflowtrend.samplingRate.[ifSpeed.]medium
-
If sFlowTrend-Pro is using SNMP to configure the switches to send sFlow, sFlowTrend-Pro will use this value to configure the sampling rate for all interfaces of the given ifSpeed. The default values are:
sflowtrend.samplingRate.medium = 512
sflowtrend.samplingRate.10.medium = 128
sflowtrend.samplingRate.100.medium = 256
sflowtrend.samplingRate.1000.medium = 512
sflowtrend.samplingRate.10000.medium = 1024
For example
sflowtrend.samplingRate.100.medium = 256tells sFlowTrend-Pro to configure all interfaces with an ifSpeed of 100 Mb/s with a sampling rate of 1 in 256. The value for
sflowtrend.samplingRate.mediumis used by sFlowTrend-Pro when configuring an interface with an ifSpeed for which a sampling rate has not been specified. For example, with the default sampling rate settings, a 4 Gb/s trunk would be configured with a sampling rate of 1 in 512.You can specify sampling rates for other ifSpeeds. For example
sflowtrend.samplingRate.8000.medium = 1024tells sFlowTrend-Pro to configure all interfaces, with an ifSpeed of 8 Gb/s, with a sampling rate of 1 in 1024.
- sflowtrend.useForce
-
The default value for this setting is
false. In this case, if sFlowTrend-Pro is using SNMP to configure the switches to send sFlow, and finds that a switch has already been configured by another application and there are no unclaimed receiver entries on the switch, then sFlowTrend-Pro will not configure the switch. In this case sFlowTrend-Pro will show the switch status as Already in use. If the value for this setting istrueand there are no unclaimed receiver entries on the switch, then sFlowTrend-Pro will overwrite the first receiver entry forcibly claim it.
- sflowtrend.natReceiverAddress
-
If sFlowTrend-Pro is using SNMP to configure switches to send sFlow and there is a NAT device between the system running sFlowTrend-Pro and the switches, use this setting to specify the public IP address and port on the NAT device that sFlow should be sent to. Note that in a virtual or container environment a virtual NAT device is often used and this setting is applicable. If you are not using SNMP to configure switches to send sFlow, then this setting is not required. For example, for a NAT device with a public IPv4 address of
10.1.2.3and a forwarded sFlow port of7070sflowtrend.natReceiverAddress = 10.1.2.3:7070or for a NAT device with a public IPv6 address of
2001:df8:3c5d:15:1a36:3ecd:dc72:ef7eand a forwarded sFlow port of7575[2001:df8:3c5d:15:1a36:3ecd:dc72:ef7e]:7575Note that you must also choose this address as the collector address, see sFlow configuration.
- server.webserver.port
-
The TCP port that the server web server will listen on. This default value is
8087. If this is changed, then a client connecting to the server must also use the new value. For example, if the port is changed to8088, then point a web browser athttp://[hostname]:8088/sflowtrend.
- server.webserver.localonly
-
By default, this setting is
false, which means that the server web server can respond to requests from any client. If you want to disallow clients other than the system that is running the server from connecting to the server, then set this property totrue.
- server.webserver.forceHttps
-
If you wish to always connect to the web server via
https, then set this setting totrue. By default, the setting isfalse. When set totrue, there are two effects:-
Any request to http is redirected to https.
-
All responses via https have the
Strict-Transport-Securityhttp header added, which causes subsequent requests from the browser to always use https, even if no protocol was specified in the URL.
If you are using this option, it is strongly recommended that you also configure a signed https certificate for the webserver, rather than using the default, self-signed one. Refer to Configuring https certificates for further information.
-
- server.webserver.https.port
-
The TCP port that the web server will use for https connections to clients. The default value is
8443. If this is changed, then a client connecting to the server must also use the new value. For example, if the port is changed to8444, then point a web browser athttps://[hostname]:8444/sflowtrend.
- server.webserver.https.keyStore
-
Filename of https key store in sFlowTrend home directory. The default value is
httpsKeyStore.
- server.webserver.https.alias
-
Alias of certificate for https in key store. The default value is
sflowtrend.
- server.webserver.https.password
-
Password for the key store. The default value is
sflowtrend.
- server.webserver.https.keyPassword
-
Password for the private key. If left blank or omitted (default), then the password for the key store is used.
- server.webserver.https.removeCiphers
-
Specifies cipher suites that are to be removed from those supported by the https web server. This setting can be used to remove insecure cipher suites. Cipher suites must be specified as a comma separated list, using standard Java naming. If this setting is used, then the default cipher suites to be removed will be overridden, so these defaults must be specified explicitly if it is desired to continue to remove them.
The current default cipher suites to remove are:
TLS_ECDHE_ECDSA_WITH_3DES_EDE_CBC_SHA
TLS_ECDHE_RSA_WITH_3DES_EDE_CBC_SHA
SSL_DHE_RSA_WITH_3DES_EDE_CBC_SHA
SSL_DHE_DSS_WITH_3DES_EDE_CBC_SHA
SSL_RSA_WITH_3DES_EDE_CBC_SHA
TLS_ECDH_ECDSA_WITH_3DES_EDE_CBC_SHA
TLS_ECDH_RSA_WITH_3DES_EDE_CBC_SHA
TLS_ECDHE_ECDSA_WITH_RC4_128_SHA
TLS_ECDHE_RSA_WITH_RC4_128_SHA
SSL_RSA_WITH_RC4_128_SHA
TLS_ECDH_ECDSA_WITH_RC4_128_SHA
TLS_ECDH_RSA_WITH_RC4_128_SHA
SSL_RSA_WITH_RC4_128_MD5
- server.webserver.https.includeCiphers
-
Specifies cipher suites that are to be included as supported by the https web server. Cipher suites must be specified as a comma separated list, using standard Java naming. This setting specifies only those cipher suites to be supported; no others will be available. This means if use this parameter, you must specify all cipher suites to be used by the web server.
- server.webserver.https.removeProtocols
-
Specifies SSL protocols that are to be removed from those supported by the https web server. This setting can be used to remove insecure protocols. Protocols must be specified as a comma separated list, using standard Java naming.
- server.webserver.https.includeProtocols
-
Specifies SSL protocols that are to be included as supported by the https web server. Protocols must be specified as a comma separated list, using standard Java naming. This setting specifies only those protocols to be supported; no others will be available. This means if use this parameter, you must specify all protocols to be used by the web server.
15.2. Customizing protocol names
sFlowTrend-Pro comes with a built-in mapping from protocol numbers (eg TCP and UDP port) to names, to make charts and reports easier to understand. If you have any site-specific protocols that you would like to add, so that they show with the correct name for your network, then this can achieved by adding a protocol definitions file.
First, create a file called protocols.txt in the sFlowTrend-Pro server home
directory (you can find this from the System configuration menu,
General tab, File location).
Make sure that you create the file on the server running the sFlowTrend-Pro service.
Then add to the file the definitions required.
The format of the file must be
[Section]
number, name
number, name
rangeStart-rangeEnd, name
number, name, longName
...

[Section]
number, name
number, name
...
Each [Section] provides definitions for a specific type of protocol number.
The sections that are currently allowed are show in
Protocol definition sections.
Following the section definition, any number of definition lines can be entered.
The definition lines start with the protocol number (in decimal), or optionally
a range of numbers, followed by a comma then the name of the protocol.
This can be optionally followed by an extended name, which is currently not used
in sFlowTrend-Pro, but could be in the future.
Protocol definition sections shows the sections than can be used, and provides an example of a definition line that might be in each section. Once you have created the file with the definitions that you require, or if you edit the file, the sFlowTrend-Pro service must be restarted for the change to take effect.
| Section | Description | Example definition |
|---|---|---|
[ETHERNET] |
Ethernet ethertype |
2048, IPv4 |
[IEEE802] |
IEEE 802.2 SAP |
170, SNAP |
[IP] |
IP protocol number |
17, UDP |
[ICMP] |
ICMP type |
8, Echo |
[TCP] |
TCP port |
80, http |
[UDP] |
UDP port |
161, snmp |
For example, this is an excerpt from the standard mapping that is included with sFlowTrend-Pro:
[IEEE802]
2,Indiv LLC Sublayer Mgt
3,Group LLC Sublayer Mgt
4,SNA Path Control

[IP]
0,HOPOPT,IPv6 Hop-by-Hop Option
1,ICMP,Internet Control Message
2,IGMP,Internet Group Management
3,GGP,Gateway-to-Gateway
4,IP,IP in IP (encapsulation)
5,ST,Stream
6,TCP,Transmission Control

[TCP]
1,tcpmux,TCP Port Service Multiplexer
2,compressnet,Management Utility
3,compressnet,Compression Process
5,rje,Remote Job Entry
7,echo,Echo
9,discard,Discard
11,systat,Active Users
13,daytime,Daytime (RFC 867)
17,qotd,Quote of the Day
18,msp,Message Send Protocol
19,chargen,Character Generator
20,ftp-data,File Transfer [Default Data]
21,ftp,File Transfer [Control]
22,ssh,SSH Remote Login Protocol
15.3. Customizing the web client appearance
It is possible to customize the appearance of the web client for individual
users using CSS.
To do this, first locate the users directory in the sFlowTrend-Pro server
home directory (which can be identified through the
System configuration menu, General tab,
File location).
Within the users directory there will be a subdirectory for each
configured user, or, if you have not configured users, there will be one
subdirectory named anonymous.user.
In the user directory, create a CSS file user.css.
Edit this file to include custom styling for the user.
The elements and classes to apply styles to can be identified using a
Web Developer, Inspector tool.
The user must refresh the sFlowTrend-Pro web page for any changes to take effect.
15.4. sFlowTrend-Pro REST API
sFlowTrend-Pro supports a RESTful API that allows flexible, programmatic access to stored data. For more details, open a support request at the InMon Corp. customer portal (https://www.myinmon.com) or send an email to sflowtrend@inmon.com.
16. Reference
16.1. Menu reference
This section contains a reference for each of the menu selections in sFlowTrend-Pro.
- User preferences
-
Brings up the User preferences dialog which allows you to change the settings for the current user. See User preferences.
- System configuration
-
Brings up the System configuration dialog, which allows you to configure various system-wide settings. See System configuration
. - Configure agents
-
Brings up the Configure agents dialog, to allow switches to be added and removed from sFlowTrend-Pro, SNMP settings changed, etc. See Configuring agents in sFlowTrend-Pro
. - Manage users
-
Brings up the Manage users dialog which allows you to configure which users have access to sFlowTrend-Pro using user authentication. See Configuring user authentication
. - Configure subnets
-
Brings up the Configure subnets dialog, to allow end host IP addresses to be grouped together in subnets using CIDRs. Grouping IP addresses into subnets allows you to view traffic between groups of addresses easily. Configuring subnets in sFlowTrend-Pro
. - Configure events
-
Brings up the Configure action on events dialog, to allow action on events to be configured, example sending email notification of events. Configuring action on events in sFlowTrend-Pro
. - Lookup host
-
Brings up the Lookup host dialog, which allows you to look up address, network location, and geographical location for end hosts. See End host information.
- Check for updates
-
Brings up a dialog that allows you to check whether a newer version of sFlowTrend-Pro is available. See Checking for updates.
- About
-
Brings up a dialog that shows information about sFlowTrend-Pro.

-
Opens a web browser and views the sFlowTrend-Pro on-line help from the web.
16.2. Database fields reference
This section contains a reference for each of the database fields. There are used in JavaScript filters, and in the select and sort statements in advanced reports.
Depending on which database table a query is being run over, different fields are available. The tables available are:
- flows
-
contains flow data from network switches (both physical and virtual). Flow data contains details of traffic, such as source and destination addresses, ports, etc.
- counters
-
contains counters data from network switches (both physical and virtual). Counters data contains volumetric data on traffic through interfaces, such as bytes, frames, errors, etc.
- hostCounters
-
contains counters data from sFlow enabled hosts. This includes information such as CPU utilization, memory usage, etc, for each host.
- services
-
contains detailed data from sFlow enabled services. This is analogous to flow data for network traffic. For example, if the apache web server has the sFlow monitoring module installed and enabled, then detail of HTTP transactions, such as URIs served, will be contained in this table.
- serviceCounters
-
contains counter data for sFlow monitored services, such as http. This data is volumetric, such as the number of requests of each HTTP method.
The fields available are keys, values or time. Keys represent aspects of the traffic being analyzed (eg a source address), while values are associated with that traffic (eg frames transmitted). Value fields can be used in a database sort statement, to sort the column in the resulting table (note that the same field must be in the select statement before it can be used in the sort statement). Additionally, there is one time field, which represents the time when traffic was observed.
The fields below are organized by database table, and by key, value and time.
16.2.1. Flows table fields
This section documents the fields available when a query is run over the flows
table.
| Term | Description | Type |
|---|---|---|
|
||
agent |
sFlow agent IP address |
string |
|
||
inputIfIndex |
switch input interface |
integer |
|
||
inputInterface |
qualified switch input interface |
integer |
ouputInterface |
qualified output interface |
integer |
clientInterface |
qualified interface associated with the client |
integer |
serverInterface |
interface associated with the server |
integer |
|
||
macSource |
source MAC address |
string |
macDestination |
destination MAC address |
string |
macClient |
client MAC address |
string |
macServer |
server MAC address |
string |
|
||
ipSource |
source IP address |
string |
ipDestination |
destination IP address |
string |
ipClient |
client IP address |
string |
ipServer |
server IP address |
string |
|
||
sourceAddress |
source address (IP if available, otherwise MAC) |
string |
destinationAddress |
destination address (IP if available, otherwise MAC) |
string |
serverAddress |
server address (IP if available, otherwise MAC) |
string |
clientAddress |
client address (IP if available, otherwise MAC) |
string |
|
||
udpSourcePort |
UDP source port |
integer |
udpDestinationPort |
UDP destination port |
integer |
udpClientPort |
UDP client port |
integer |
udpServerPort |
UDP server port |
integer |
|
||
tcpSourcePort |
TCP source port |
integer |
tcpDestinationPort |
TCP destination port |
integer |
tcpClientPort |
TCP client port |
integer |
tcpServerTCP |
TCP server port |
integer |
|
||
sourcePort |
source port (L4 port, L3 protocol or L2 ethertype) |
string |
destinationPort |
destination port (L4 port, L3 protocol or L2 ethertype |
string |
clientPort |
client port (L4 port, L3 protocol or L2 ethertype) |
string |
serverPort |
server port (L4 port, L3 protocol or L2 ethertype) |
string |
|
||
vlanSource |
source VLAN |
integer |
vlanDestination |
destination VLAN |
integer |
vlanClient |
client VLAN |
integer |
vlanServer |
server VLAN |
integer |
cVLAN |
customer VLAN in IEEE 802.1ad or IEEE 802.1ah frame |
integer |
sVLAN |
service VLAN in IEEE 802.1ad or IEEE 802.1ah frame |
integer |
|
||
vlanStack |
VLANs in IEEE 802.1ad tagged frame, separated by ':' |
string |
isQinQ |
true if flow includes IEEE 802.1ad Q-in-Q fields |
boolean |
|
||
prioritySource |
source (802.1p) priority |
integer |
priorityDestination |
destination (802.1p) priority |
integer |
priorityClient |
client (802.1p) priority |
integer |
priorityServer |
server (802.1p) priority |
integer |
cPriority |
customer priority in IEEE 802.1ad or IEEE 802.1ah frame |
integer |
sPriority |
service priority in IEEE 802.1ad or IEEE 802.1ah frame |
integer |
|
||
ieee802SAP |
IEEE 802 SAP |
integer |
|
||
ipTOS |
IP type of service (TOS) |
integer |
ipTTL |
IP time to live (TTL) |
integer |
ipProtocol |
layer 4 protocol (eg 6 for TCP, 17 for UDP) |
integer |
icmpType |
ICMP type |
integer |
|
||
isUnicast |
true if a unicast destination |
boolean |
isMulticast |
true if a multicast destination |
boolean |
isL3Multicast |
true if a layer 3 multicast destination |
boolean |
isBroadcast |
true if a broadcast destination |
boolean |
|
||
inputOrOutputIfIndex |
the input or output ifIndex |
integer |
inputOrOutputInterface |
the input or output qualified interface |
string |
|
||
isRouted |
true if this packet was routed |
boolean |
ipNextHopRouter |
next hop address if this packet was routed |
string |
sourceMaskLength |
number of bits in the source mask if this packet was routed |
integer |
destinationMaskLength |
number of bits in the destination mask if this packet was routed |
integer |
|
||
destinationNATAddress |
Destination address before NAT |
string |
sourceNATAddress |
Source address before NAT |
string |
destinationNATPort |
Destination port before NAT |
integer |
sourceNATPort |
Source port before NAT |
integer |
|
||
egressVNI |
Virtual Network Identifier used to identify the traffic on egress from the switch |
integer |
ingressVNI |
Virtual Network Identifier used to identify the traffic on ingress to the switch |
integer |
|
||
isPBB |
true if flow includes IEEE 802.1ah PBB fields |
boolean |
iSID |
service identifier in IEEE 802.1ah I-TAG |
integer |
iPriority |
priority flag in IEEE 802.1ah I-TAG |
integer |
cMacSource |
Customer IEEE 802.1ad source MAC address encapsulated in IEEE 802.1ah frame |
string |
cMacDestination |
Customer IEEE 802.1ad destination MAC address encapsulated in 802.1ah frame |
string |
|
||
isGeneve |
true if tunneling protocol is Geneve |
boolean |
isGRE |
true if tunneling protocol is GRE |
boolean |
isNVGRE |
true if tunneling protocol is NVGRE |
boolean |
isVXLAN |
true if tunneling protocol is VXLAN |
boolean |
greKey |
GRE key field |
integer |
greVersion |
GRE version number |
integer |
vni |
virtual network identifier (VXLAN, Geneve) |
integer |
vsid |
virtual subnet identifier (NVGRE) |
integer |
macSource.1 |
source MAC address of inner encapsulated packet |
string |
macDestination.1 |
destination MAC address of inner encapsulated packet |
string |
macClient.1 |
client MAC address of inner encapsulated packet |
string |
macServer.1 |
server MAC address of inner encapsulated packet |
string |
ipSource.1 |
source IP address of inner encapsulated packet |
string |
ipDestination.1 |
destination IP address of inner encapsulated packet |
string |
ipClient.1 |
client IP address of inner encapsulated packet |
string |
ipServer.1 |
server IP address of inner encapsulated packet |
string |
sourceAddress.1 |
highest layer source address of inner encapsulated packet (IP if available, otherwise MAC) |
string |
destinationAddress.1 |
highest layer destination address of inner encapsulated packet (IP if available, otherwise MAC) |
string |
serverAddress.1 |
highest layer server address of inner encapsulated packet (IP if available, otherwise MAC) |
string |
clientAddress.1 |
highest layer client address of inner encapsulated packet (IP if available, otherwise MAC) |
string |
udpSourcePort.1 |
UDP source port of inner encapsulated packet |
integer |
udpDestinationPort.1 |
UDP destination port of inner encapsulated packet |
integer |
udpClientPort.1 |
UDP client port of inner encapsulated packet |
integer |
udpServerPort.1 |
UDP server port of inner encapsulated packet |
integer |
tcpSourcePort.1 |
TCP source port of inner encapsulated packet |
integer |
tcpDestinationPort.1 |
TCP destination port of inner encapsulated packet |
integer |
tcpClientPort.1 |
TCP client port of inner encapsulated packet |
integer |
tcpServerTCP.1 |
TCP server port of inner encapsulated packet |
integer |
sourcePort.1 |
highest layer source port (L4 port, L3 protocol or L2 ethertype) of inner encapsulated packet |
string |
destinationPort.1 |
highest destination port (L4 port, L3 protocol or L2 ethertype of inner encapsulated packet |
string |
clientPort.1 |
highest client port (L4 port, L3 protocol or L2 ethertype) of inner encapsulated packet |
string |
serverPort.1 |
highest layer server port (L4 port, L3 protocol or L2 ethertype) of inner encapsulated packet |
string |
vlanSource.1 |
source VLAN of inner encapsulated packet |
integer |
vlanDestination.1 |
destination VLAN of inner encapsulated packet |
integer |
vlanClient.1 |
client VLAN of inner encapsulated packet |
integer |
vlanServer.1 |
server VLAN of inner encapsulated packet |
integer |
prioritySource.1 |
source (802.1p) priority of inner encapsulated packet |
integer |
priorityDestination.1 |
destination (802.1p) priority of inner encapsulated packet |
integer |
priorityClient.1 |
client (802.1p) priority of inner encapsulated packet |
integer |
priorityServer.1 |
server (802.1p) priority of inner encapsulated packet |
integer |
ieee802SAP.1 |
IEEE 802 SAP of inner encapsulated packet |
integer |
ipTOS.1 |
IP type of service (TOS) of inner encapsulated packet |
integer |
ipTTL.1 |
IP time to live (TTL) of inner encapsulated packet |
integer |
ipProtocol.1 |
layer 4 protocol (eg 6 for TCP, 17 for UDP) of inner encapsulated packet |
integer |
icmpType.1 |
ICMP type of inner encapsulated packet |
integer |
isUnicast.1 |
true if a unicast destination of inner encapsulated packet |
boolean |
isMulticast.1 |
true if a multicast destination of inner encapsulated packet |
boolean |
isL3Multicast.1 |
true if a layer 3 multicast destination of inner encapsulated packet |
boolean |
isBroadcast.1 |
true if a broadcast destination of inner encapsulated packet |
boolean |
|
||
bgpAS |
The local Autonomous System number |
integer |
bgpNextHop |
Next-hop router from BGP routed traffic |
string |
bgpSourceAS |
Source Autonomous System number from BGP routed traffic |
integer |
bgpSourcePeerAS |
Source peer Autonomous System number from BGP routed traffic |
integer |
bgpDestinationAS |
Destination Autonomous System number from BGP routed traffic |
integer |
bgpDestinationPeerAS |
Destination peer Autonomous System number from BGP routed traffic |
integer |
bgpDestinationASPath |
The destination Autonomous System path from BGP routed traffic |
string |
bgpCommunities |
Communities from BGP routed traffic |
string |
bgpLocalPref |
LocalPref from BGP routed traffic |
integer |
|
||
mplsLabelStackIn |
The received MPLS label stack |
string |
mplsLabelStackOut |
The transmitted MPLS label stack |
string |
isMPLS |
true for traffic decoded as MPLS |
boolean |
|
||
isWireless |
true if this packet was send on a wireless network |
boolean |
wifiFrameControl |
802.11 frame control |
integer |
wifiReceiverAddress |
802.11 receiver address |
string |
wifiTransmitterAddress |
802.11 transmitter address |
string |
wifiCipher |
802.11 cipher suite |
integer |
wifiCipherFormatted |
802.11 cipher suite, formatted into the convention hex string form (OUI-OUI-OUI-Suite) |
string |
wifiCipherName |
The name of the 802.11 cipher suite |
string |
wifiTxSSID |
802.11 transmit SSID |
string |
wifiTxBSSID |
802.11 transmit BSSID |
string |
wifiTxVersion |
802.11 protocol transmitted |
string |
wifiTransmissions |
802.11 number of transmissions |
integer |
wifiTxDuration |
802.11 transmitted packet duration |
integer |
wifiRetransmitDuration |
802.11 retransmit duration |
integer |
wifiTxChannel |
802.11 transmit channel |
integer |
wifiTxSpeed |
802.11 transmit speed |
integer |
wifiTxPower |
802.11 transmit RSNI |
integer |
wifiRxSSID |
802.11 receive SSID |
string |
wifiRxBSSID |
802.11 receive BSSID |
string |
wifiRxVersion |
802.11 protocol received |
string |
wifiRxChannel |
802.11 receive channel |
integer |
wifiRxSpeed |
802.11 receive speed |
integer |
wifiRSNI |
802.11 RSNI |
integer |
wifiRCPI |
802.11 RCPI |
integer |
wifiRxDuration |
802.11 received packet duration |
integer |
|
||
wifiVersion |
802.11 protocol for transmit or receive |
string |
wifiSpeed |
802.11 speed for transmit or receive |
integer |
wifiSSID |
802.11 SSID for transmit or receive |
string |
wifiBSSID |
802.11 BSSID for transmit or receive |
string |
wifiDuration |
802.11 duration for transmit or receive |
integer |
wifiChannel |
802.11 channel for transmit or receive |
integer |
| Term | Description | Type |
|---|---|---|
|
||
bytesFromServer |
Bytes sent from the server |
integer |
bytesToServer |
Bytes sent to the server |
integer |
bytesIn |
Bytes received. |
integer |
bytesOut |
Bytes sent. |
integer |
bytesTotal |
Total number of bytes |
integer |
|
||
framesFromServer |
Frames sent from the server |
integer |
framesToServer |
Frames sent to the server |
integer |
framesIn |
Frames received |
integer |
framesOut |
Frames sent |
integer |
framesTotal |
Total number of frames |
integer |
|
||
synCount |
The number of TCP/IP packets with SYN set |
integer |
synAckCount |
The number of TCP/IP packets with both SYN and ACK set |
integer |
|
||
wifiAirUtilizationIn |
Percent utilization of the receive channel |
integer |
wifiAirUtilizationOut |
Percent utilization of the transmit channel |
integer |
wifiAirUtilizationTotal |
Total utilization of the channel |
integer |
16.2.2. Counters table fields
This section documents the fields available when a query is run over the
counters table.
| Term | Description | Type |
|---|---|---|
|
||
agent |
sFlow agent IP address |
string |
|
||
ifIndex |
The switch interface associated with the counters |
integer |
|
||
interface |
The qualified switch interface associated with the counters |
integer |
| Term | Description | Type |
|---|---|---|
|
||
framesIn |
The total of all non-error received frames |
integer |
framesOut |
The total of all non-error transmitted frames |
integer |
ifInBroadcasts |
Number of received broadcast frames |
integer |
ifOutBroadcasts |
Number of transmitted broadcast frames |
integer |
ifInMulticasts |
Number of received multicast frames |
integer |
ifOutMulticasts |
Number of transmitted multicast frames |
integer |
ifInUcasts |
Number of received unicast frames |
integer |
ifOutUcasts |
Number of transmitted unicast frames |
integer |
ifInOctets |
Number of received bytes |
integer |
ifOutOctets |
Number of transmitted bytes |
integer |
ifInErrors |
Number of received errors |
integer |
ifOutErrors |
Number of transmitted errors |
integer |
ifInDiscards |
Number of received discards |
integer |
ifOutDiscards |
Number of transmitted discards |
integer |
ifInErrorsAndDiscards |
The total of received errors and discards |
integer |
ifOutErrorsAndDiscards |
The total of transmitted errors and discards |
integer |
utilizationIn |
The ingress utilization |
integer |
utilizationOut |
The egress utilization |
integer |
|
||
ifStatus |
Bit 0: ifAdminStatus, bit 1: ifOperStatus |
integer |
ifType |
The ifType (see IANAIfType) |
integer |
ifSpeed |
The interface speed in bits/second |
integer |
ifDirection |
0 = unknown, 1 = full-duplex, 2 = half-duplex, 3 = in, 4 = out |
integer |
ifPromiscuousMode |
Interface promiscuous mode |
integer |
ifUnknownProtos |
Count of unknown protocols |
integer |
|
||
wifiAssociated |
Number of associated stations |
integer |
wifiTxFragments |
Number of transmitted fragments |
integer |
wifiTxFrames |
Number of transmitted frames |
integer |
wifiTxMulticasts |
Number of transmitted multicast frames |
integer |
wifiRxFragments |
Number of received fragments |
integer |
wifiRxMulticasts |
Number of received multicast frames |
integer |
wifiRetries |
Number of retried frames |
integer |
wifiMultiRetries |
Number of multiple retries |
integer |
wifiFailures |
Number of failed frames |
integer |
wifiAckFailures |
Number of acknowledgement failures |
integer |
wifiRTSFailures |
Number of RTS failures |
integer |
wifiRTSSuccesses |
Number of RTS successes |
integer |
wifiFCSErrors |
Number of FCS errors |
integer |
wifiDuplicates |
Number of duplicate frames |
integer |
wifiWEPUndecryptable |
Number of undecryptable frames |
integer |
|
||
wifiElapsedTime |
Total elapsed time in ms |
integer |
wifiOnChannelTime |
Total time spent on channel in ms |
integer |
wifiOnChannelBusyTime |
Busy time spent on channel in ms |
integer |
|
||
wifiQoSCFRx |
Number of CF frames received |
integer |
wifiQoSCFLost |
Number of CF frames lost |
integer |
wifiQoSCFUnusable |
Number of CF frames unusable |
integer |
wifiQoSCFUnused |
Number of CF frames unused |
integer |
wifiQoSDiscards |
Number of discarded frames |
integer |
16.2.3. Host counters table fields
This section documents the fields available when a query is run over the
hostCounters table.
| Term | Description | Type |
|---|---|---|
|
||
agent |
sFlow agent IP address |
string |
|
||
datasource |
sFlow datasource for the host |
string |
parent |
The sFlow datasource for the parent of this host |
string |
|
||
hostname |
The host’s hostname |
string |
UUID |
A String representing the UUID of the host in standard RFC 4122 format |
string |
|
||
machineType |
The architecture of the system |
string |
osName |
The name of the OS running on the host |
string |
osRelease |
The release version string of the OS running on the host |
string |
|
||
isVirtual |
|
boolean |
| Term | Description | Type |
|---|---|---|
|
||
cpuIdle |
Idle CPU time in ms |
integer |
cpuIntr |
Time in ms servicing interrupts |
integer |
cpuNice |
Nice CPU time in ms |
integer |
cpuSoftIntr |
Time in ms servicing soft interrupts |
integer |
cpuSystem |
System CPU time in ms |
integer |
cpuTotal |
Total CPU time available in ms (the sum of all of the other CPU time fields, including idle) |
integer |
cpuUser |
User CPU time in ms |
integer |
cpuWIO |
Time in ms waiting for I/O to complete |
integer |
vCpuTime |
Virtual CPU time in ms |
integer |
cpuNum |
Number of CPUs in the system |
integer |
vCpuNum |
Number of virtual CPUs assigned to system |
integer |
cpuSpeed |
Speed in MHz of the CPU |
integer |
loadOne |
One-minute load average |
integer |
loadFive |
Five-minute load average |
integer |
loadFifteen |
Fifteen-minute load average |
integer |
procRun |
Total number of runnable processes |
integer |
procTotal |
Total number of processes |
integer |
contexts |
Count of context switches |
integer |
interrupts |
Count of interrupts |
integer |
uptime |
Seconds since the last reboot |
integer |
vNodeCpuNum |
Number of physical CPUs in a virtualized host |
integer |
vNodeCpuSpeed |
Expected speed of the physical CPUs in a virtualized host |
integer |
|
||
cpuIdleUtil |
Percentage of idle CPU time |
integer |
cpuIntrUtil |
Percentage of CPU time servicing interrupts |
integer |
cpuNiceUtil |
Percentage of nice CPU time |
integer |
cpuSoftIntrUtil |
Percentage of CPU time servicing soft interrupts |
integer |
cpuSystemUtil |
Percentage of system CPU time |
integer |
cpuUserUtil |
Percentage of user CPU time |
integer |
cpuUtil |
Percentage of non-idle CPU time |
integer |
cpuWIOUtil |
Percentage of CPU time waiting for I/O to complete |
integer |
vCpuTimeUtil |
Percentage utilization of virtual CPU time |
integer |
|
||
diskFree |
Free disk space in bytes |
integer |
diskTotal |
Total disk size in bytes |
integer |
diskUsed |
Total space used on disk |
integer |
diskReads |
Number of read operations from disk |
integer |
bytesRead |
Number of bytes read from disk |
integer |
readTime |
Time in ms reading from disk |
integer |
diskWrites |
Number of write operations completed to disk |
integer |
bytesWritten |
Number of bytes written to disk |
integer |
writeTime |
Time in ms writing to disk |
integer |
vDiskAlloc |
Disk space allocated to virtual system |
integer |
vDiskAvail |
Disk space available to virtual system |
integer |
vDiskCapacity |
Capacity of disk for virtual system |
integer |
vDiskErrors |
Number of virtual disk errors |
integer |
vDiskReadBytes |
Number of bytes read by virtual system |
integer |
vDiskReadReqs |
Number of read requests by virtual system |
integer |
vDiskWriteBytes |
Number of bytes written by virtual system |
integer |
vDiskWriteReqs |
Number of write requests by virtual system |
integer |
|
||
diskFreeUtil |
Free disk space expressed as a percentage of total space |
integer |
diskUsedUtil |
Used disk space expressed as a percentage of total space |
integer |
partitionMaxUsed |
Utilization of the highest utilized partition expressed as a percentage |
integer |
vDiskAllocUtil |
Disk space allocated to virtual system expressed as a percentage of capacity |
integer |
vDiskAvailUtil |
Disk space available to virtual system expressed as a percentage of capacity |
integer |
|
||
memoryBuffers |
Bytes of memory used for buffers |
integer |
memoryCache |
Bytes of memory used for cache |
integer |
memoryFree |
Free bytes of memory |
integer |
memoryShared |
Shared bytes of memory |
integer |
memoryTotal |
Total bytes of memory |
integer |
memoryUsed |
Bytes of memory used (= memoryTotal-memoryFree-memoryShared-memoryBuffers-memoryCache) |
integer |
memoryUsedTotal |
Total bytes of memory used (= memoryTotal-memoryFree) |
integer |
swapFree |
Free bytes of swap space |
integer |
swapTotal |
Total bytes of swap space |
integer |
swapUsed |
Bytes of swap space used |
integer |
pageIn |
Page in count |
integer |
pageOut |
Page out count |
integer |
swapIn |
Swap in count |
integer |
swapOut |
Swap out count |
integer |
vMemory |
Memory in bytes used by virtual system |
integer |
vMemoryFree |
Free memory in bytes available to virtual system |
integer |
vMemoryMax |
Maximum memory in bytes available to virtual system |
integer |
vNodeMemTotal |
Total size of physical memory in bytes in a virtualized host |
integer |
vNodeMemUsed |
Used physical memory in bytes in a virtualized host |
integer |
vNodeMemFree |
Free physical memory in bytes in a virtualized host |
integer |
|
||
memoryBuffersUtil |
Percentage of memory used for buffers |
integer |
memoryCacheUtil |
Percentage of memory used for cache |
integer |
memoryFreeUtil |
Percentage of memory free |
integer |
memorySharedUtil |
Percentage of memory shared |
integer |
memoryUsedUtil |
Percentage of memory used (see memoryUsed) |
integer |
memoryUsedTotalUtil |
Percentage of used total memory (see memoryUsedTotal) |
integer |
swapFreeUtil |
Percentage of swap space free |
integer |
swapUsedUtil |
Percentage of swap space used |
integer |
vMemoryUtil |
Memory used by virtual system expressed as a percentage of the total available |
integer |
vMemoryFreeUtil |
Free memory available to virtual system expressed as a percentage of the total available |
integer |
vNodeMemUsedUtil |
Used physical memory in a virtualized host, expressed as a percentage of the total available |
integer |
vNodeMemFreeUtil |
Free physical memory in a virtualized host, expressed as a percentage of the total available |
integer |
|
||
hostBytesIn |
Bytes received by the host |
integer |
hostBytesOut |
Bytes sent by the host |
integer |
hostPacketsIn |
Packets received by the host |
integer |
hostPacketsOut |
Packets send by the host |
integer |
hostErrorsIn |
Error packets received by the host |
integer |
hostErrorsOut |
Error packets send by the host |
integer |
hostDropsIn |
Dropped packets received by the host |
integer |
hostDropsOut |
Dropped packets send by the host |
integer |
vNetRxBytes |
Bytes received by a virtual system |
integer |
vNetTxBytes |
Bytes transmitted by a virtual system |
integer |
vNetRxPackets |
Packets received by a virtual system |
integer |
vNetTxPackets |
Packets transmitted by a virtual system |
integer |
vNetRxErrors |
Error packets received by a virtual system |
integer |
vNetTxErrors |
Error packets transmitted by a virtual system |
integer |
vNetRxDrops |
Dropped packets received by a virtual system |
integer |
vNetTxDrops |
Dropped packets transmitted by a virtual system |
integer |
|
||
vState |
The state of a virtualized host (see the libvirt documentation) |
integer |
virtualDomains |
The number of active domains in a virtualized host |
integer |
16.2.4. Services table fields
This section documents the fields available when a query is run over the
services table.
| Term | Description | Type |
|---|---|---|
|
||
agent |
sFlow agent IP address |
string |
|
||
datasource |
sFlow datasource for the service |
string |
|
||
service |
The name of the service (eg http) |
string |
|
||
inputIfIndex |
the input interface for the request |
integer |
outputIfIndex |
the output interface for the request |
integer |
|
||
inputInterface |
qualified input interface for the request |
integer |
outputInterface |
qualified output interface for the request |
integer |
|
||
ipLocal |
the local IP address associated with the request |
string |
ipRemote |
the remote IP address associated with the request |
string |
ipClient |
client IP address |
string |
ipServer |
server IP address |
string |
|
||
udpLocalPort |
the local UDP port associated with the request |
integer |
udpRemotePort |
the remote UDP port associated with the request |
integer |
udpClientPort |
UDP client port |
integer |
udpServerPort |
UDP server port |
integer |
|
||
tcpLocalPort |
the local TCP port associated with the request |
integer |
tcpRemotePort |
the remote TCP port associated with the request |
integer |
tcpClientPort |
TCP client port |
integer |
tcpServerTCP |
TCP server port |
integer |
|
||
localPort |
The local port associated with the request |
string |
remotePort |
The remote port associated with the request |
string |
clientPort |
The client port associated with the request |
string |
serverPort |
The server port associated with the request |
string |
|
||
ipProtocol |
layer 4 protocol (eg 6 for TCP, 17 for UDP) |
integer |
|
||
httpHost |
The host from the HTTP request |
string |
httpMethod |
The method from the HTTP request |
string |
httpProtocol |
The HTTP protocol version, encoded as major_number*1000+minor_number, eg HTTP1.1 is encoded as 1001 |
string |
httpReferrer |
The referrer from the HTTP request |
string |
httpURI |
The full URI from the HTTP request |
string |
httpURIPath |
The path from the URI. The path starts after the protocol, and ends at the start of the query |
string |
httpURIFile |
The file from the URI. The file is the last component of the path |
string |
httpURIExtn |
The file extension from the URI |
string |
httpUserAgent |
The user agent from the HTTP request |
string |
httpXForwardedFor |
The X-Forwarded-For field from the HTTP request |
string |
httpAuthUser |
The auth user from the HTTP request, if present |
string |
httpStatus |
The status of the response to an HTTP request |
integer |
httpMimeType |
The mime type of the response to an HTTP request |
string |
| Term | Description | Type |
|---|---|---|
|
||
framesTotal |
Number of frames or transactions |
integer |
numSamples |
Number of samples seen |
integer |
|
||
httpDuration |
The mean duration of HTTP transactions, from start of request to end of response |
integer |
httpDuration |
The mean duration of HTTP transactions, from start of request to end of response |
integer |
httpRequestBytes |
The number of bytes in an HTTP request |
integer |
httpResponseBytes |
The number of bytes in an HTTP response |
integer |
httpTotalBytes |
The total number of bytes in a combined HTTP request and response |
integer |
16.2.5. Service counters table fields
This section documents the fields available when a query is run over the
serviceCounters table.
| Term | Description | Type |
|---|---|---|
|
||
agent |
sFlow agent IP address |
string |
|
||
datasource |
sFlow datasource for the service |
string |
parent |
The sFlow datasource for the parent of this service |
string |
|
||
service |
The name of the service (eg http) |
string |
| Term | Description | Type |
|---|---|---|
|
||
httpMethodConnectCount |
Count of http CONNECT methods |
integer |
httpMethodDeleteCount |
Count of http DELETE methods |
integer |
httpMethodGetCount |
Count of http GET methods |
integer |
httpMethodHeadCount |
Count of http HEAD methods |
integer |
httpMethodOptionCount |
Count of http OPTION methods |
integer |
httpMethodPostCount |
Count of http POST methods |
integer |
httpMethodPutCount |
Count of http PUT methods |
integer |
httpMethodTraceCount |
Count of http TRACE methods |
integer |
httpMethodOtherCount |
Count of other http methods |
integer |
httpStatus1xxCount |
Count of http status 1xx |
integer |
httpStatus2xxCount |
Count of http status 3xx |
integer |
httpStatus3xxCount |
Count of http status 3xx |
integer |
httpStatus4xxCount |
Count of http status 4xx |
integer |
httpStatus 5xxCount |
Count of http status 5xx |
integer |
httpStatusOtherCount |
Count of other http status |
integer |
16.2.6. Time fields
This section documents the time fields available. Time fields are common for all of the tables.
[[timeFields.table] .Database time fields
| Term | Description | Type |
|---|---|---|
|
||
time |
The time when traffic was observed |
string |
16.2.7. Metadata fields
This section documents the metadata fields available. These fields can be used to provide additional information on each row of a result. They cannot be used for filters.
| Term | Description | Type |
|---|---|---|
|
||
isOther |
true if a row represents the "other" value in a top-n, false otherwise |
boolean |
noData |
true if a row represents a time interval with no data, false otherwise |
boolean |
16.3. Filter functions reference
This section contains a reference for each of functions that can be used in JavaScript filters.
| Function | Description | Type |
|---|---|---|
|
||
inSubnet(address, subnet, maskBits) |
returns |
boolean |
inSubnet(address, subnetName) |
returns |
boolean |
inIPRange(address, rangeStart, rangeEnd) |
returns |
boolean |
|
||
outputIfIndexIncludes(ifIndex) |
returns |
boolean |
16.4. Database functions
This section contains the reference information for database functions. Database functions are used within the select and sort (for value functions) statements in advanced reports, and take either database fields or other database functions as arguments. They allow the values from database fields to be modified before they are added to the result of running a query.
Database functions are divided into three types: key functions, which return a database key, value functions, which return a database value, and time functions, which operate on time. Each function can be used wherever the corresponding field can be used. They can each be used in a database select, to add a column to the resulting table. Value functions only can also be used in a sort statement, to sort the resulting table on that column.
16.4.1. Labels in database functions
Each function takes an optional string argument as the first parameter.
If provided, this string is called the function label, and is used within charts
and tables within the report, to display the name of the function.
For example, to resolve the source address within a chart, you might use
resolve("Source name", sourceAddress).
This specifies that when the name of the function is to be displayed, for
example within the legend of a chart or the heading of a table, then the label
Source name should be used.
If this first parameter is not specified, then the function itself will be
displayed (resolve(sourceAddress) in the example).
Using labels for functions is a way to make charts and tables more legible and understandable.
16.4.2. Key functions
countryCode
Synopsis
countryCode([label,] ipAddress)
Description
In addition to the optional label argument, described in
Labels in database functions, countryCode takes a single argument which
must be an IPv4 address.
The address can either be an address field (eg sourceAddress), or a literal
address (eg "64.151.76.40").
It returns the ISO 3166 country code of the country in which the address is
located, if known.
If the country is not known, or the parameter is not an IPv4 address, then the
empty string is returned.
Example
To select the sourceAddress and country code, use these fields in
the select statement: sourceAddress, countryCode(sourceAddress).
countryName
Synopsis
countryName([label,] ipAddress)
Description
countryName takes a single argument in addition to the optional label, which
must be an IPv4 address.
The address can either be an address field (eg sourceAddress), or a literal
address (eg "64.151.76.40").
It returns the name of the country in which the address is located, if known.
If the country is not known, or the parameter is not an IPv4 address, then the
empty string is returned.
Example
To select the country of the clientAddress, use this field in the
select statement: countryCode("Country", clientAddress).
This will also use the label Country in a table heading or chart legend.
hostname
Synopsis
hostname([label,] uuid) or hostname([label,] macAddress)
Description
hostname takes a single argument, in addition to the optional label, which can
be a UUID or a MAC address.
The argument can either be a key field (eg macSource or uuid), or a literal
address or UUID (eg 00248C70AB58 or 6ba7b811-9dad-11d1-80b4-00c04fd430c8).
It returns the hostname associated with the UUID or MAC address, if know through
host sFlow.
If the address is not a UUID or MAC address, or the hostname cannot be
determined, then the empty string is returned.
Example
To select the hostname of the hosts in a host counters query, use this field in
the select statement: hostname(uuid).
ifAlias
Synopsis
ifAlias([label,] interface)
Description
ifAlias takes a single argument, in addition to the optional label, which must
be an interface field (note that ifAlias does not take an ifIndex
parameter).
It returns the ifAlias of the interface, if known.
If the ifAlias is not known, or the parameter is not an interface, then the
empty string is returned.
Example
To select the inputInterface and ifAlias from a switch, use these
fields in the select statement: inputInterface, ifAlias(inputInterface).
ifAliasOrVMName
Synopsis
ifAliasOrVMName([label,] interface)
Description
ifAliasOrVMName takes a single argument, in addition to the optional label,
which must be an interface field (note that ifAliasOrVMName does not take
an ifIndex parameter).
It returns the ifAlias of the interface, if known.
If the ifAlias is not known, then it returns the name of the virtual machine
attached to the interface.
If there is no ifAlias, and no VM attached to the interface, or the parameter is
not an interface, then the empty string is returned.
Example
To select the inputInterface and ifAlias or VM name from a switch,
use these fields in the select statement:
inputInterface, ifAliasOrVMName(inputInterface).
ifName
Synopsis
ifName([label,] interface)
Description
ifName takes a single argument, in addition to the optional label, which must
be an interface field (note that ifName does not take an
ifIndex parameter).
It returns the ifName of the interface, if known.
If the ifName is not known, or the parameter is not an interface, then the empty
string is returned.
Example
To select the ifName of the outputInterface from a switch, use this field in
the select statement: ifName(outputInterface).
ifOrVMName
Synopsis
ifOrVMName([label,] interface)
Description
ifOrVMName takes a single argument, in addition to the optional label, which
must be an interface field (note that ifOrVMName does not take an
ifIndex parameter).
It returns the ifName of the interface, if known.
If the ifName is not known, then it returns the name of the virtual machine
attached to the interface.
If there is no ifName, and no VM attached to the interface, or the parameter is
not an interface, then the empty string is returned.
Example
To select the ifOrVMName of the outputInterface from a switch, use this field
in the select statement: ifOrVMName(outputInterface).
locate
Synopsis
locate([label,] address)
Description
locate takes a single argument, in addition to the optional label, which must
be an address.
The address can either be an address field (eg sourceAddress), or a literal
address (eg "64.151.76.40"). It returns the interface where the address is
most likely to be located in the monitored network, if it can be determined.
If the location cannot be determined, then the empty string is returned.
Note that the address of an external system would most likely be located on a
router interface.
The location of an address can only be determined if network traffic from that
address has been observed.
Example
To select the sourceAddress and location of the source address, use these
fields in the select statement: sourceAddress, locate(sourceAddress).
locateSwitch
Synopsis
locateSwitch([label,] address)
Description
locateSwitch takes a single argument, in addition to the optional label,
which must be an address.
The address can either be an address field (eg sourceAddress), or a literal
address (eg "64.151.76.40").
It works in the same way as locate, but returns
only the switch where the address is most likely to be located, rather than the
complete interface.
If the location cannot be determined, then the empty string is returned.
Example
To select the sourceAddress and switch where the source address is located,
use these fields in the select statement:
sourceAddress, locateSwitch(sourceAddress).
mac
Synopsis
mac([label,] address)
Description
mac takes a single argument, in addition to the optional label, which must be
an address.
The address can either be an address field (eg sourceAddress), or a literal
address (eg "64.151.76.40"). It returns the most likely MAC address associated
with the address if can be determined.
If the address is already a MAC address, then it will be returned.
If the MAC cannot be determined, then the empty string is returned.
The MAC address associated with a layer 3 address can only be determined if
network traffic from that address has been observed.
Example
To select the sourceAddress and MAC address associated with the source
address, use these fields in the select statement:
sourceAddress, mac(sourceAddress).
vendor
Synopsis
vendor([label,] macAddress)
Description
vendor takes a single argument, in addition to the optional label, which must
be a MAC address.
The address can either be an address field (eg sourceAddress), or a literal
address (eg "00248C70AB58").
It returns the vendor associated with the address.
If the address is not a MAC address or the vendor cannot be determined, then the
empty string is returned.
Example
To select the source MAC address and vendor, use these fields in the select
statement: macSource, vendor(macSource).
getParent
Synopsis
getParent([label,] hostname) or getParent([label,] macAddress) or getParent([label,] uuid)
Description
getParent takes a single argument, in addition to the optional label, which
can be a hostname, a MAC address or a UUID.
The argument can either be a key field (eg hostname, macSource, or uuid),
or a literal hostname, address or UUID (eg google.com, "00248C70AB58" or
"6ba7b811-9dad-11d1-80b4-00c04fd430c8").
It returns the hostname, MAC address or UUID (respectively) associated with the
parent of the host identified by the hostname, MAC address or UUID specified.
getParent is used to find system containment.
For example, the parent of a virtual host is the physical host that is running
the virtual one.
Example
To select the hostname of parent, of the host with hostname server.inmon.com in
a host counters query, use this field in the select statement:
getParent("server.inmon.com").
To select the UUID of the parent, of the host with UUID 6ba7b811-9dad-11d1-80b4-00c04fd430c8 in a host counters query, use this field in the select statement: ` getParent("6ba7b811-9dad-11d1-80b4-00c04fd430c8") `
resolve
Synopsis
resolve([label,] address)
resolve([label,] port)
Description
resolve takes a single argument, in addition to the optional label, which
must be an address or port field.
It returns the resolved name of the address or port, if known.
If the resolved name is not known, or the parameter is not an address or port,
then the empty string is returned.
Note that resolve only works with the highest layer port fields
(eg sourcePort), not with the numeric ports (such as tcpSourcePort).
Example
To select the sourceAddress, resolved name of the source address, and the
resolved name of the sourcePort, use these fields in the select statement:
sourceAddress, resolve(sourceAddress), resolve(sourcePort).
subnet
Synopsis
subnet([label,] ipAddress)
Description
subnet takes a single argument, in addition to the optional label, which must
be an IP address field.
It returns the name of the smallest defined subnet that the address belongs to.
If the address does not belong to a subnet, then the name of the external subnet
is returned.
If the parameter is not an IP address, then the empty string is returned.
For this function to be useful, subnets must have first been defined
in sFlowTrend-Pro; see Configuring subnets in sFlowTrend-Pro for more information.
Example
To select the sourceAddress and the subnet that sourceAddress belongs to,
use these fields in the select statement:
sourceAddress, subnet(sourceAddress).
uuid
Synopsis
uuid([label,] hostname) or uuid([label,] macAddress)
Description
uuid takes a single argument, in addition to the optional label, which can
be a hostname or a MAC address.
The argument can either be a key field (eg macSource or hostname), or a
literal address or hostname (eg "00248C70AB58" or "google.com").
It returns the UUID associated with the MAC address or hostname, if know through
host sFlow.
If the hostname or address is not valid, or the UUID cannot be determined, then
the empty string is returned.
Example
To select the uuid of the host server.inmon.com in a host counters query, use
this field in the select statement: uuid("server.inmon.com").
vmName
Synopsis
vmName([label,] interface)
Description
vmName takes a single argument, in addition to the optional label, which must
be an interface field (note that vmName does not take an ifIndex
parameter).
It returns the name of the virtual machine attached to the interface, if there
is one.
If there is no VM attached to the interface, or if the parameter is not an
interface, then the empty string is returned.
Example
To select the virtual machine name for a VM attached to virtual switch interface
inputInterface, use this field in the select statement:
vmName(inputInterface).
16.4.3. Value functions
count
Synopsis
count([label,] keyField [, keyField, …]))
Description
count is an unusual function, which takes any number of key fields as
arguments, in addition to the optional label, and returns a value field.
It counts the number of unique combinations of all the key fields observed.
This is useful if you are trying to understand for example, how many different
connections a host made, rather than the specifics of each connection.
Example
To select each source, and the total number of destinations that each source
connected to, you could use the following fields in a select:
sourceAddress, count(sourceAddress, destinationAddress).
max
Synopsis
max([label,] valueField1, valueField2)
Description
max returns the larger of the values of two value fields.
Either or both of the fields can also be other value functions, in addition to
constant fields, to allow more complex expressions to be created.
max is most useful when both the arguments are of similar type - eg frames, or
bytes, etc.
Example
To select the larger of ingress frames and egress frames, use this field in the
select statement: max(framesIn, framesOut).
To select the larger of the ingress frames per second and egress frames per
second, you would use a combination of the max function and the rate
function (see rate):
max("Frame rate", rate(framesIn), rate(framesOut)).
This example uses a label ("Frame rate") which means that the function will
be displayed as Frame rate in table headings and chart legends.
min
Synopsis
min([label,] valueField1, valueField2)
Description
min returns the smaller of the values of two value fields.
Either or both of the fields can also be other value functions, in addition to
constant fields, to allow more complex expressions to be created.
min is most useful when both the arguments are of similar type - eg frames, or
bytes, etc.
Example
To select the smaller of ingress bytes and egress bytes, use this field in the
select statement: min(bytesIn, bytesOut).
percent
Synopsis
percent([label], valueField)
Description
percent takes a single value field as a parameter, in addition to the optional
label, and converts it to a percent of the value over the interval.
For example, it would convert a frames field into percent of frames of the
relevant interval.
Example
To select the percent of total frames in the interval, use this field in the
select statement: percent(framesTotal).
rate
Synopsis
rate([label,] valueField)
Description
rate takes a single value field as a parameter, in addition to the optional
label, and converts it to a value per second (ie a rate).
For example, it would convert a frames field into frames per second.
Example
To select the total frames per second, use this field in the select statement:
rate(framesTotal).
scale
Synopsis
scale([label,] valueField, factor)
Description
scale takes a single value field as a parameter, in addition to the optional
label, and scales it by a constant factor, given as the second argument.
The factor can be a real number.
This is very useful to convert a bytes field into bits - use a scale factor of
8.
Example
To select the total bits per second, first of all scale total bytes to get bits,
then convert it into a rate: rate(scale(bytesTotal, 8)).
sum
Synopsis
sum([label,] valueField1, valueField2)
Description
sum adds the values of two values, and returns the result.
Either or both of the fields can be other value functions, in addition to
constant fields, to allow more complex expressions to be created.
Example
To select the sum of ingress multicasts and broadcasts, use this field in the
select statement: sum(ifInMulticasts, ifInBroadcasts).
16.4.4. Time functions
format
Synopsis
format([label,] time, [[todayFormat], otherDayFormat])
Description
format takes up to three arguments, in addition to the optional label: the
first must be the time field (time).
The second, optionally, is a Java time and date format string that will be used
to format time which is in today.
The third argument is a format string that will be used to format time that is
not in today.
If the second argument is missing, the same format string will be used to format
all time, regardless of whether it is in today or not.
If both the second and third arguments are missing, then default formats are
used, which formats time in today with a short time (no date), and formats time
in other days in with a short time and date.
For documentation on how to construct a format string, please see the Java data format documentation.
Example
To select time formatted with the default formatter, use this field in the
select statement: format(time).
To select time formatted as 24 hour time, without the date, for today, and
including a short date for other days, use this field in the select statement:
format(time, "HH:mm", "dd/MM/yy HH:mm").
timestamp
Synopsis
timestamp([label,] time)
Description
timestamp takes a single argument, in addition to the optional label, which
must be the time field (time), and returns the timestamp corresponding to the
time.
The timestamp is the number of milliseconds since January 1st, 1970.
Example
To select the timestamp of data, use this field in the select statement:
timestamp(time).
16.5. Classes and objects defined within scripted reports
Scripted reports use a standard JavaScript environment to execute a script. Additional classes and objects are available within the script to allow the report to be generated. This section is a reference of the classes and objects available.
16.5.1. Objects defined
The following objects can be referenced from a scripted report:
report
Synopsis
report
Description
report is the single instance of the Report class available.
The report object represents the current report being generated.
Invoking any of the methods defined for the Report class on it will have the
appropriate result on the report generated (for example, adding a chart).
Example
To add a table of results to a report, use the code
report.table(data);where data is the result of running a previous query.
reportVars
Synopsis
reportVars.variable
Description
reportVars is an object with a property defined for each of the report
variables specified in the scripted report tab.
The name of each property is the name of the variable, and the value of the
property is the value defined for that variable.
This allows the values of the defined variables to be used from within the
report script.
Example
You might want to parameterize the timeframe for the report to run over.
To do this, add a variable timeframe, and enter its value as "today".
Then from within the report script, refer to this value by
reportVars.timeframe; you would probably use this to specify the period for a
query.
When the report is run, it would generate data for today.
If you then changed the variable value to lastHour, then the report would
generate data for lastHour, without the script itself having to be changed.
16.5.2. Classes defined
The following classes are defined in the environment of a scripted report:
Chart
Synopsis
Chart.setWidth(int width)
Chart.setHeight(int height)
Description
Chart is the class of a chart generated within a report.
An instance of a chart is obtained as the return value of the chart and
timeChart methods in Report.
After a chart has been created, its size can be modified from the default using
the setWidth and setHeight methods.
Example
To generate a chart (using the previous data from a query), and change its
size, use the code:
var newChart = report.timeChart("lineChart", data,
                                "sourceAddress, resolve(sourceAddress)",
                                "%1$s(%2$s", "rate(framesTotal)");
newChart.setWidth(1000);
newChart.setHeight(800);
Query
Synopsis
Query(String table, String view,
      String select, String filter,
      String period, int interval, String sort,
      boolean decreasingOrder,
      boolean sortPerInterval, int n,
      boolean allowNullKeys = false);
Query.run()
Description
Query is the class which defines a query to run on the database.
The methods are:
Query(table, view, select, filter, period, interval, sort, decreasingOrder, sortPerInterval, n, allowNullKeys)-
Creates a new
Query. The parameters are:-
table: the database table to run the query on. Current valid tables are"flows","counters","hostCounters","serviceCounters","services", or"events". -
view: the view of the database table required. The view can be thought of as a specific perspective on the data. If the view is the empty string, then all data is included. If it is a list of IP addresses of switches/routers, then only data from these devices is included. If you only want data for one switch interface, then use a string of the form"switch>ifIndex", whereswitchis the IP address of the switch, andifIndexthe ifIndex of the interface. Finally, a set hosts can be specified. To do this, use a view of the formhosts(host1, host2,..). Each host can be specified by hostname or UUID. -
select: is a string containing a list of the database fields and functions required to select from the database for the query. -
filter: is a JavaScript filter for the query. If not required, leave as the empty string. -
period: the time that the query should run over. This is a string parameter, with values one of"last5Mins","last10Mins","last15Mins","last30Mins","lastHour","last6Hours","last12Hours","last24Hours","today","yesterday","thisWeek","lastWeek". Additionally, arbitrary periods can be specified using dates of the form"yyyy-MM-dd HH:mm to yyyy-MM-dd HH:mm". The month and day are specified using digits, and the time is specified using 24-hour clock, for example"2012-10-05 10:00 to 2012-10-05 14:00"would run the query from 10:00 on October 5th, 2012 to 14:00 on the same day. The time is in the local timezone on the client. -
interval: the size of each bucket (in minutes) in the resulting data. If this is set to 0, then only one bucket will be created. -
sort: the field or function which to sort the data by. This field or function must have previously been included in the select statement. If no sorting is required, leave as the empty string. -
decreasingOrder: iftruethen the data will be sorted with the largest first, iffalsethen the data is sorted smallest first. -
sortPerInterval: iftruethen sorting will be performed independently per bucket generated in the results. If a value is specified forn, then each bucket will have the top-n for that interval. Iffalse, then the sort will be applied across all of the data in the period. If a value fornis specified, then the top-n is generated over the entire period. -
n: the number of entries to include in the results, before including everything else in an "other" entry. This is used to create top-n queries. If set to0, then all data is returned. Note that including all data can make the query significantly slower, and use more memory. -
allowNullKeys: iffalse, then when running a query, if any of the key fields evaluate tonull, then the traffic associated with this field will be discarded. This is normally the most useful setting; this parameter to the query is optional, if not specified it will default tofalse. However, setting it totrueallows a null value to be selected, which may be useful if you are trying to view traffic which specifically has null values (eg if an IP address is selected from layer 2 traffic).
-
Query.run()-
Runs the query, returning a
Table.
Example
To create a query on the flows table, for top 5 sources by total frames, over the last hour with 1 minute buckets, and then run it, use the code
var query = new Query("flows", "",
                      'timestamp("Timestamp", time), sourceAddress,
                      resolve("Source name", sourceAddress), rate(framesTotal)',
                      "", "lastHour", 1, "rate(framesTotal)", true, false, 5);
var result = query.run();
Report
Synopsis
Report.chart(type, data, categoryFields, categoryFormat,
             seriesFields, seriesFormat,
             valueFields [, title]);
Report.paragraph(text);
Report.table(data [, title]);
Report.timeChart(type, data, seriesFields, seriesFormat, valueFields [, title]);
Description
Report is the class of the current report object
(see report).
The methods defined within Report allow data to be added to a report.
The methods are:
chart(type, data, categoryFields, categoryFormat, seriesFields, seriesFormat, valueFields [, title])-
creates a chart (note: not a time-based chart; for this, use a
timeChart) in the report. The parameters are:-
type: a string representing the type of chart to be generated in the report. Current valid options are:"barChart","stackedBarChart","areaChart","stackedAreaChart","lineChart". -
data: aTable, which is obtained from running a query. -
categoryFields: a string containing a list of database key fields and key functions, which should form the categories to be displayed in the chart (ie on the x-axis). Each of the fields must be present in thedataby selecting them in the query. The categories formed will be the combination of all of the specified fields in each row of the data. Note that this parameter is of type string, and any embedded strings within it (eg strings within database functions) must be correctly escaped to avoid JavaScript errors. -
categoryFormat: a format string which can be used to make the combination of the category fields more legible (see Editing a query using advanced settings). If this parameter is empty, then the category fields will be presented as a comma-separated list. -
seriesFields: a string containing a list of database key fields and key functions, which should form the series to be displayed in the chart. Each of the fields must be present in thedataby selecting them in the query. The series formed will be the combination of all of the specified fields in each row of the data. Note that this parameter is of type string, and any embedded strings within it (eg strings within database functions) must be correctly escaped to avoid JavaScript errors. -
seriesFormat: a format string which can be used to make the combination of the series fields more legible (see Editing a query using advanced settings). If this parameter is empty, then the series fields will be presented as a comma-separated list. -
valueFields: a string containing a list of database value fields and value functions, which should form the values to be displayed in the chart. Each of the fields must be present in thedataby selecting them in the query. Note that this parameter is of type string, and any embedded strings within it (eg strings within database functions) must be correctly escaped to avoid JavaScript errors. -
title: an optional title for the chart. If this parameter is not provided, then one will be generated automatically.
-
paragraph(text)-
inserts the string parameter
textinto the report, as an html paragraph. This can be used to add additional text to the report. table(data [, title])-
creates an html table containing the results in
data. A row will be created in the html table for each row indata, and the columns of the table will be formed from each field present indata.titleis an optional string parameter, used for the table title. If this is not present, then a title will be automatically generated. timeChart(type, data, seriesFields, seriesFormat, valueFields [, title])-
creates a time-based chart, with time on the x-axis. Note that for this chart to work, the
timestamp(time)function (see timestamp) must be present in the data, by including this function within the query select. The parameters are:-
type: a string representing the type of chart to be generated in the report. Current valid options are:"barChart","stackedBarChart","areaChart","stackedAreaChart","lineChart". -
data: aTable, which is obtained from running a query. -
seriesFields: a string containing a list of database key fields and key functions, which should form the series to be displayed in the chart. Each of the fields must be present in thedataby selecting them in the query. The series formed will be the combination of all of the specified fields in each row of the data. Note that this parameter is of type string, and any embedded strings within it (eg strings within database functions) must be correctly escaped to avoid JavaScript errors. -
seriesFormat: a format string which can be used to make the combination of the series fields more legible (see Editing a query using advanced settings). If this parameter is empty, then the series fields will be presented as a comma-separated list. -
valueFields: a string containing a list of database value fields and value functions, which should form the values to be displayed in the chart. Each of the fields must be present in thedataby selecting them in the query. Note that this parameter is of type string, and any embedded strings within it (eg strings within database functions) must be correctly escaped to avoid JavaScript errors. -
title: an optional title for the chart. If this parameter is not provided, then one will be generated automatically.
-
Example
To generate a bar chart (using the previous data from a query, assuming that
this data includes the fields sourceAddress and framesTotal), use the code
var newChart = report.chart("barChart", data,
                            "sourceAddress", "",
                            /* Category fields, no need for category format */
                            "", "", /* No need for series */
                            "framesTotal"); /* values */
Example
To generate a time based line chart (using the previous data from a query,
assuming that this data includes the fields timestamp(time), sourceAddress
and framesTotal), use the code:
var newChart = report.timeChart("lineChart", data,
                                "sourceAddress", "", /* No need for series format */
                                "framesTotal"); /* values */
Table
Synopsis
Table.getStart()
Table.getEnd()
Table.getInterval()
Description
Table is the class of a database table created by running a query.
After running a query, the instance of the Table returned is then used to
create a chart or html table.
The start and end times of the data contained within a Table can be obtained
using the getStart() and getEnd() methods.
getInterval() returns the time interval of the data, in milliseconds.
Example
To generate a table of data by running a query, use the code:
var query = new Query("flows", "",
                      'timestamp("Timestamp", time), sourceAddress,\
                      resolve("Source name", sourceAddress), rate(framesTotal)',
                      "", "lastHour", 1, "rate(framesTotal)", true, false, 5);
var data = query.run();
report.paragraph("Start of data: "+data.getStart());
Appendix A: Configuring switches to send sFlow
Your switches must be configured to send sFlow to sFlowTrend-Pro. There are two methods for configuring sFlow: telling sFlowTrend-Pro to configure the switch using SNMP, or using the command line interface (CLI) on the switch.
A.1. Using SNMP to configure the switch to send sFlow
sFlowTrend-Pro can use SNMP to configure a switch to send sFlow. You will need to make sure that the switch is configured to allow SNMP read/write access from sFlowTrend-Pro. You will also need to know the SNMP v2 read/write community string or the SNMP v3 settings that will allow write access. See Adding a switch configured via SNMP for details on how to set up sFlowTrend-Pro so that it uses SNMP to configure a switch to send sFlow.
Alcatel-Lucent and ProCurve Networking by HP switches support SNMP configuration of sFlow.
A.1.1. Configuring ProCurve switches to allow sFlow configuration via SNMP
You can use SNMP to configure ProCurve switches (except the 9300 and 9400 series) to send sFlow. For this to be possible you must ensure that sFlowTrend-Pro uses an SNMP community that is configured on the switch with unrestricted write access and that the IP address of the host running sFlowTrend-Pro is included in the list of authorized managers configured on the switch.
Assuming that sFlowTrend-Pro is running on host with IP address 10.1.2.5 and is
using the read/write SNMP community snmprw, access the command line interface
on the ProCurve switch and take the following steps to set up the switch so that
it will allow sFlowTrend-Pro to configure sFlow via SNMP:
-
Configure the SNMP community so that it will allow any MIB variable that has read/write access to be set:
(config)# snmp-server community snmprw manager unrestrictedThen verify this setting with:
(config)# show snmp-serverThe result should be something like:
SNMP Communities Community Name MIB View Write Access ---------------- -------- ------------ snmprw Manager Unrestricted -
Configure the IP authorized managers to include the IP address of the host running sFlowTrend-Pro :
(config)# ip authorized-managers 10.1.2.5Then verify this setting with:
(config)# show ip authorized-managersThe result should be something like:
 IP Managers

 Authorized Manager IP IP Mask        Access Level
 ---------------------- ---------------------- -------------
 10.1.2.5        255.255.255.255    Manager
A.2. Using the switch CLI to configure sFlow
Using this method you must access the switch using its web interface, ssh, or telnet, and manually configure the switch to send sFlow to the IP address and UDP port that sFlowTrend-Pro is using to receive sFlow (see sFlow configuration for information on determining and configuring the IP address and UDP port). You should enable sFlow on 1 or more interfaces on the switch, set a sampling rate (Recommended sampling rates), and configure a counter polling interval. The counter polling interval controls how frequently the interface counters will be exported as part of the sFlow data. We recommend a counter polling interval of 20 or 30 seconds. We recommend that you enable sFlow on all interfaces. You should also determine the SNMP read community string for the switch so that you can configure sFlowTrend-Pro with this community string. This will allow sFlowTrend-Pro to query the switch for interface and system names.
Some example CLI configurations for enabling sFlow globally are given in the
following sections.
The configurations are for sFlowTrend-Pro running on a system with IP address
10.1.2.5 and receiving sFlow data on UDP port 6343, with the sFlow agent
address which uniquely identifies the switch explicitly set to 10.10.10.1
(where possible).
Many switches support a command to show the current sFlow configuration and to indicate whether data has been exported:
show sflowSee your switch documentation for more details.
A.2.1. Alcatel-Lucent OmniSwitch
-> ip interface loopback0 10.10.10.1
-> sflow receiver 1 name sFlowTrend address 10.1.2.5 udp-port 6343
-> sflow sampler 1 1/1-24 receiver 1 rate 128
-> sflow poller 1 1/1-24 receiver 1 interval 30| The OmniSwitches also support the configuration of sFlow using SNMP. |
A.2.2. Brocade (Foundry Networks)
config> int e 1/1 to 4/48
interface> sflow forwarding
config> sflow destination 10.1.2.5 6343
config> sflow sample 128
config> sflow polling-interval 30
config> sflow enable
A.2.3. D-Link
The following commands apply to the D-Link xStack® DGS-3600 series switch:
enable sflow
create sflow analyzer_server 1 owner analyzer1 timeout infinite collectoraddress 10.1.2.5
create sflow counter_poller ports all analyzer_server_id 1 interval 30
create sflow flow_sampler ports all analyzer_server_id 1 rate 128
A.2.4. Enterasys
set sflow receiver 1 owner analyzer1 timeout 180000
set sflow receiver 1 ip 10.1.2.5

#configure packet sampling instances on ports 1 through 12
#assign to sFlow Collector 1
set sflow port ge.1.1-12 sampler 1
set sflow port ge.1.1-12 sampler maxheadersize 128
set sflow port ge.1.1-12 sampler rate 128

#configure counter poller instances on ports 1 through 12
#assign to sFlow Collector 1
set sflow port ge.1.1-12 poller 1
set sflow port ge.1.1-12 poller interval 30
A.2.5. Extreme Networks
enable sflow
configure sflow-agent 10.10.10.1
configure sflow-collector 10.1.2.5 port 6343
configure sflow sample-rate 128
configure sflow poll-interval 30
configure sflow backoff-threshold 50
enable sflow backoff-threshold
enable sflow ports all
A.2.6. Force10 Networks
Force10(conf)# sflow enable
Force10(conf)# sflow collector 10.1.2.5 agent-addr 10.10.10.1 6343
Force10(conf)# sflow sample-rate 128
Force10(conf)# sflow polling-interval 30
A.2.7. H3C
<sysname> system-view
[Sysname] sflow agent ip 10.10.10.1
[Sysname] sflow collector ip 10.1.2.5 port 6343
[Sysname] sflow version 5
[Sysname] sflow interval 30
[Sysname] interface ethernet 1/0
[Sysname-Ethernet1/0] sflow enable inbound
[Sysname-Ethernet1/0] sflow sampling-mode random
[Sysname-Etherent1/0] sflow sampling-rate 128| Set the sampling-mode to random on all interfaces that support random sampling. Deterministic sampling is less accurate and should be avoided. The sampling direction should be set consistently across all interfaces, in this example enabling inbound sampling on all interfaces monitors all traffic paths through the switch and avoids double counting. |
A.2.8. Juniper Networks
The best way to find the appropriate commands for sFlow on your Juniper switch is to search the Juniper web site. As a starting point, here is an example configuration:
sflow {
  polling-interval 30;
  sample-rate 128;
  collector 10.1.2.5 {
  udp-port 6343;
  }
  interfaces ge-0/0/0.0;
  interfaces ge-0/0/1.0;
  interfaces ge-0/0/2.0;
  interfaces ge-0/0/3.0;
  interfaces ge-0/0/4.0;
  interfaces ge-0/0/5.0;
  interfaces ge-0/0/6.0;
  interfaces ge-0/0/7.0;
  interfaces ge-0/0/8.0;
  interfaces ge-0/0/9.0;
  interfaces ge-0/0/10.0;
  interfaces ge-0/0/11.0;
  interfaces ge-0/0/12.0;
  interfaces ge-0/0/13.0;
  interfaces ge-0/0/14.0;
  interfaces ge-0/0/15.0;
  interfaces ge-0/0/16.0;
  interfaces ge-0/0/17.0;
  interfaces ge-0/0/18.0;
  interfaces ge-0/0/19.0;
  interfaces ge-0/0/20.0;
  interfaces ge-0/0/21.0;
  interfaces ge-0/0/22.0;
  interfaces ge-0/0/23.0 {
    polling-interval 30;
    sample-rate 128;
  }
}
A.2.9. Netgear
sflow receiver 1 owner collector1 timeout 4294967295 ip 10.1.2.5For each interface:
sflow sampler 1 rate 128
sflow poller 1 interval 30
A.2.10. ProCurve Networking by HP
All ProCurve switches that support sFlow (except the 9300 and 9400 series) can be configured using SNMP. In addition, the ProCurve 3500 and 5400 series switches can be configured to send sFlow using the CLI.
(config)# sflow 1 destination 10.1.2.5 6343
(config)# sflow 1 sampling ethernet A1-A24 128
(config)# sflow 1 polling ethernet A1-A24 30| ProCurve 9300 and 9400 switches must be configured using the CLI using the syntax given for Foundry switches. All other ProCurve switches can also be configured using SNMP to send sFlow. |
Appendix B: Configuring hosts to send sFlow
Your hosts must be configured to send sFlow to sFlowTrend-Pro. Eventually, it is expected that operating system vendors will integrate sFlow directly into their products. Until then, an add-on agent is available for host sFlow from https://sflow.net.
B.1. Installing the host sFlow agent
Currently, the host sFlow agent is available in RPM form for Linux, as a Windows installer, and as an RPM for XenServer. The source code is also available if you would prefer to build it from scratch, perhaps for a different operating system. Download the package appropriate for your systems, and install using the normal methods for each operating system.
B.2. Configuring the host sFlow agent
If you are installing the agent on Windows, then the installer will ask for the IP address of the sFlow collector as part of the installation. Just enter the IP address of your installation of sFlowTrend-Pro, and then when the installation is complete, host sFlow will be sent there.
When installing on Linux, a little more configuration is required. This can be done in two ways: either via DNS Service Discovery (DNS-SD) (see Linux configuration using DNS Service Discovery) or by editing a configuration file (Linux configuration using the configuration file). First, perform one of these configuration steps. Once complete, then start the service using the normal Linux service management command:
# service hsflowd startB.2.1. Linux configuration using DNS Service Discovery
If you are able to configure your local DNS servers, then the recommended way to configure host sFlow on Linux is via DNS Service Discovery. The sFlow configuration is placed into DNS records, which are then read by each sFlow host agent. This allows a large network of hosts to be easily configured and reconfigured as required.
The default configuration file is set for DNS-SD, so no changes are required there. Just add the following records to your DNS servers (used by the hosts to be monitored), and the hosts will then pick up the configuration automatically.
The following is an example configuration for DNS-SD.
One TXT record should be created, with the name field _sflow._udp.
This defines the overall sampling parameters for the agent.
Following this, add an SRV record to specify each collector (eg instance of
sFlowTrend-Pro) to send sFlow to.
_sflow._udp       TXT   "txtvers=1" "sampling=400" "polling=20"
                  SRV   0 0 6343 sflowtrend.inmon.com
                  SRV   0 0 6343 10.1.2.5.
This specifies a sample rate of 1 in 400, a counter polling rate of every 20
seconds (recommended settings), and then two sFlow destinations: one host called
sflowtrend.inmon.com, and another with the IP address of 10.1.2.5, both
using the standard UDP 6343 sFlow port.
Note that the period after an IP address is often required.
For your configuration, replace the SRV entries with those appropriate to your
installation.
B.2.2. Linux configuration using the configuration file
If you are unable to modify your DNS servers, or would prefer just to try out host sFlow by editing the configuration file on a few systems, then follow this example.
The configuration file is /etc/hsflowd.conf.
Edit this file, and first change the line DNSSD to
DNSSD = offThis switches off DNS-SD; otherwise, the rest of the configuration file is
ignored.
Then, uncomment the collector section at the end of the file, and modify to
suit your installation.
To have the same effect as the example in
Linux configuration using DNS Service Discovery use this for the configuration file:
sflow {
    packetSamplingRate=400
    counterPollingInterval=20
    collector {
        ip=sflowtrend.inmon.com
        udpport=6343
    }
    collector {
        ip = 10.1.2.5
        udpport = 6343
    }
}
Appendix C: Recommended sampling rates
Recommended sampling rates gives the recommended packet sampling rates for sFlow for different interface speeds and traffic levels.
| Traffic level | |||
|---|---|---|---|
ifSpeed |
Low |
Medium |
High |
10Mb/s |
64 |
128 |
256 |
100Mb/s |
128 |
256 |
512 |
1Gb/s |
256 |
512 |
1024 |
10Gb/s |
512 |
1024 |
2048 |
Low, medium and high traffic levels are usually found in the following situations:
- Low
-
administrative office environment.
- Medium
-
typical mixed use environment with file servers and web browsing.
- High
-
computing clusters, large ISP backbone/hosting.
Appendix D: Acknowledgements and copyright
Licensed under the Apache License, Version 2.0 (the "License");
you may not use this file except in compliance with the License.
You may obtain a copy of the License at

  https://www.apache.org/licenses/LICENSE-2.0

Unless required by applicable law or agreed to in writing, software
distributed under the License is distributed on an "AS IS" BASIS,
WITHOUT WARRANTIES OR CONDITIONS OF ANY KIND, either express or implied.
See the License for the specific language governing permissions and
limitations under the License.
Copyright 2000-2009 by Object Refinery Limited and Contributors.
jFreeChart is distributed under the terms of the GNU Lesser General Public License (LGPL).
Batik is distributed under the terms of the Apache License version 2.0.
 Copyright (C) 2000-2012 Jason Hunter & Brett McLaughlin.
 All rights reserved.

 Redistribution and use in source and binary forms, with or without
 modification, are permitted provided that the following conditions
 are met:

 1. Redistributions of source code must retain the above copyright
  notice, this list of conditions, and the following disclaimer.

 2. Redistributions in binary form must reproduce the above copyright
  notice, this list of conditions, and the disclaimer that follows
  these conditions in the documentation and/or other materials
  provided with the distribution.

 3. The name "JDOM" must not be used to endorse or promote products
  derived from this software without prior written permission. For
  written permission, please contact <request_AT_jdom_DOT_org>.

 4. Products derived from this software may not be called "JDOM", nor
  may "JDOM" appear in their name, without prior written permission
  from the JDOM Project Management <request_AT_jdom_DOT_org>.

 THIS SOFTWARE IS PROVIDED ``AS IS'' AND ANY EXPRESSED OR IMPLIED
 WARRANTIES, INCLUDING, BUT NOT LIMITED TO, THE IMPLIED WARRANTIES
 OF MERCHANTABILITY AND FITNESS FOR A PARTICULAR PURPOSE ARE
 DISCLAIMED. IN NO EVENT SHALL THE JDOM AUTHORS OR THE PROJECT
 CONTRIBUTORS BE LIABLE FOR ANY DIRECT, INDIRECT, INCIDENTAL,
 SPECIAL, EXEMPLARY, OR CONSEQUENTIAL DAMAGES (INCLUDING, BUT NOT
 LIMITED TO, PROCUREMENT OF SUBSTITUTE GOODS OR SERVICES; LOSS OF
 USE, DATA, OR PROFITS; OR BUSINESS INTERRUPTION) HOWEVER CAUSED AND
 ON ANY THEORY OF LIABILITY, WHETHER IN CONTRACT, STRICT LIABILITY,
 OR TORT (INCLUDING NEGLIGENCE OR OTHERWISE) ARISING IN ANY WAY OUT
 OF THE USE OF THIS SOFTWARE, EVEN IF ADVISED OF THE POSSIBILITY OF
 SUCH DAMAGE.

 This software consists of voluntary contributions made by many
 individuals on behalf of the JDOM Project and was originally
 created by Jason Hunter <jhunter_AT_jdom_DOT_org> and
 Brett McLaughlin <brett_AT_jdom_DOT_org>. For more information
 on the JDOM Project, please see www.jdom.org.
Flying Saucer is distributed under the terms of the GNU Lesser General Public License (LGPL).
HtmlCleaner is distributed under the terms of the BSD license.
Copyright (c) 2006-2017, HtmlCleaner team.
All rights reserved.

Redistribution and use of this software in source and binary forms,
with or without modification, are permitted provided that the
following conditions are met:

* Redistributions of source code must retain the above
 copyright notice, this list of conditions and the
 following disclaimer.

* Redistributions in binary form must reproduce the above
 copyright notice, this list of conditions and the
 following disclaimer in the documentation and/or other
 materials provided with the distribution.

* The name of HtmlCleaner may not be used to endorse or promote
 products derived from this software without specific prior
 written permission.

THIS SOFTWARE IS PROVIDED BY THE COPYRIGHT HOLDERS AND CONTRIBUTORS
"AS IS" AND ANY EXPRESS OR IMPLIED WARRANTIES, INCLUDING, BUT NOT
LIMITED TO, THE IMPLIED WARRANTIES OF MERCHANTABILITY AND FITNESS FOR
A PARTICULAR PURPOSE ARE DISCLAIMED. IN NO EVENT SHALL THE COPYRIGHT
OWNER OR CONTRIBUTORS BE LIABLE FOR ANY DIRECT, INDIRECT, INCIDENTAL,
SPECIAL, EXEMPLARY, OR CONSEQUENTIAL DAMAGES (INCLUDING, BUT NOT
LIMITED TO, PROCUREMENT OF SUBSTITUTE GOODS OR SERVICES; LOSS OF USE,
DATA, OR PROFITS; OR BUSINESS INTERRUPTION) HOWEVER CAUSED AND ON ANY
THEORY OF LIABILITY, WHETHER IN CONTRACT, STRICT LIABILITY, OR TORT
(INCLUDING NEGLIGENCE OR OTHERWISE) ARISING IN ANY WAY OUT OF THE USE
OF THIS SOFTWARE, EVEN IF ADVISED OF THE POSSIBILITY OF SUCH DAMAGE.
OpenPDF is distributed under the terms of the Mozilla Public License Version 2.0.
Jetty is distributed under the terms of the Apache License version 2.0.
Jackson is distributed under the terms of the Apache License version 2.0.
Copyright 2014 Attila Szegedi, Daniel Dekany, Jonathan Revusky
Apache FreeMarker is distributed under the terms of the Apache License v2.0.
FreeMarker subcomponents with different copyright owners
--------------------------------------------------------

FreeMarker, both in its source code and binary form (freemarker.jar)
includes a number of files that are licensed by the Apache Software
Foundation under the Apache License, Version 2.0. This is the same
license as the license of FreeMaker, but the copyright owner is the
Apache Software Foundation. These files are:

  freemarker/ext/jsp/web-app_2_2.dtd
  freemarker/ext/jsp/web-app_2_3.dtd
  freemarker/ext/jsp/web-jsptaglibrary_1_1.dtd
  freemarker/ext/jsp/web-jsptaglibrary_1_2.dtd
cron4j is distributed under the terms of the GNU Lesser General Public License (LGPL).
Copyright (c) jQuery Foundation and other contributors.
This software consists of voluntary contributions made by many individuals. For exact contribution history, see the revision history available at https://github.com/jquery/jquery.
jQuery and jQuery UI are distributed under the MIT license.
Copyright (c) 2009-2015 Chris Leonello.
jqPlot is distributed under the MIT license.
Timepicker Addon is distributed under the MIT license.
Copyright (c) 2013 Trent Richardson

Permission is hereby granted, free of charge, to any person obtaining a copy of
this software and associated documentation files (the "Software"), to deal in
the Software without restriction, including without limitation the rights to
use, copy, modify, merge, publish, distribute, sublicense, and/or sell copies
of the Software, and to permit persons to whom the Software is furnished to do
so, subject to the following conditions:

The above copyright notice and this permission notice shall be included in all
copies or substantial portions of the Software.

THE SOFTWARE IS PROVIDED "AS IS", WITHOUT WARRANTY OF ANY KIND, EXPRESS OR
IMPLIED, INCLUDING BUT NOT LIMITED TO THE WARRANTIES OF MERCHANTABILITY,
FITNESS FOR A PARTICULAR PURPOSE AND NONINFRINGEMENT. IN NO EVENT SHALL THE
AUTHORS OR COPYRIGHT HOLDERS BE LIABLE FOR ANY CLAIM, DAMAGES OR OTHER
LIABILITY, WHETHER IN AN ACTION OF CONTRACT, TORT OR OTHERWISE, ARISING FROM,
OUT OF OR IN CONNECTION WITH THE SOFTWARE OR THE USE OR OTHER DEALINGS IN THE
SOFTWARE.
jQuery Split Pane plugin is distributed under the MIT license
Copyright (c) 2014 - 2016 Simon Hagström

Permission is hereby granted, free of charge, to any person obtaining a copy of
this software and associated documentation files (the "Software"), to deal in
the Software without restriction, including without limitation the rights to
use, copy, modify, merge, publish, distribute, sublicense, and/or sell copies
of the Software, and to permit persons to whom the Software is furnished to do
so, subject to the following conditions:

The above copyright notice and this permission notice shall be included in all
copies or substantial portions of the Software.

THE SOFTWARE IS PROVIDED "AS IS", WITHOUT WARRANTY OF ANY KIND, EXPRESS OR
IMPLIED, INCLUDING BUT NOT LIMITED TO THE WARRANTIES OF MERCHANTABILITY,
FITNESS FOR A PARTICULAR PURPOSE AND NONINFRINGEMENT. IN NO EVENT SHALL THE
AUTHORS OR COPYRIGHT HOLDERS BE LIABLE FOR ANY CLAIM, DAMAGES OR OTHER
LIABILITY, WHETHER IN AN ACTION OF CONTRACT, TORT OR OTHERWISE, ARISING FROM,
OUT OF OR IN CONNECTION WITH THE SOFTWARE OR THE USE OR OTHER DEALINGS IN THE
SOFTWARE.
jQuery Mouse Wheel plugin is distributed under the MIT license
Copyright (c) jQuery Foundation and other contributors https://jquery.org

This software consists of voluntary contributions made by many
individuals. For exact contribution history, see the revision history
available at https://github.com/jquery/jquery-mousewheel.

Permission is hereby granted, free of charge, to any person obtaining a copy of
this software and associated documentation files (the "Software"), to deal in
the Software without restriction, including without limitation the rights to
use, copy, modify, merge, publish, distribute, sublicense, and/or sell copies
of the Software, and to permit persons to whom the Software is furnished to do
so, subject to the following conditions:

The above copyright notice and this permission notice shall be included in all
copies or substantial portions of the Software.

THE SOFTWARE IS PROVIDED "AS IS", WITHOUT WARRANTY OF ANY KIND, EXPRESS OR
IMPLIED, INCLUDING BUT NOT LIMITED TO THE WARRANTIES OF MERCHANTABILITY,
FITNESS FOR A PARTICULAR PURPOSE AND NONINFRINGEMENT. IN NO EVENT SHALL THE
AUTHORS OR COPYRIGHT HOLDERS BE LIABLE FOR ANY CLAIM, DAMAGES OR OTHER
LIABILITY, WHETHER IN AN ACTION OF CONTRACT, TORT OR OTHERWISE, ARISING FROM,
OUT OF OR IN CONNECTION WITH THE SOFTWARE OR THE USE OR OTHER DEALINGS IN THE
SOFTWARE.
jsTree is distributed under the MIT license
Copyright (c) Copyright (c) 2014 Ivan Bozhanov

Permission is hereby granted, free of charge, to any person obtaining a copy of
this software and associated documentation files (the "Software"), to deal in
the Software without restriction, including without limitation the rights to
use, copy, modify, merge, publish, distribute, sublicense, and/or sell copies
of the Software, and to permit persons to whom the Software is furnished to do
so, subject to the following conditions:

The above copyright notice and this permission notice shall be included in all
copies or substantial portions of the Software.

THE SOFTWARE IS PROVIDED "AS IS", WITHOUT WARRANTY OF ANY KIND, EXPRESS OR
IMPLIED, INCLUDING BUT NOT LIMITED TO THE WARRANTIES OF MERCHANTABILITY,
FITNESS FOR A PARTICULAR PURPOSE AND NONINFRINGEMENT. IN NO EVENT SHALL THE
AUTHORS OR COPYRIGHT HOLDERS BE LIABLE FOR ANY CLAIM, DAMAGES OR OTHER
LIABILITY, WHETHER IN AN ACTION OF CONTRACT, TORT OR OTHERWISE, ARISING FROM,
OUT OF OR IN CONNECTION WITH THE SOFTWARE OR THE USE OR OTHER DEALINGS IN THE
SOFTWARE.
DataTables is distributed under the MIT license
Copyright (c) 2008-2017, SpryMedia Ltd.

Permission is hereby granted, free of charge, to any person obtaining a copy
of this software and associated documentation files (the "Software"), to deal
in the Software without restriction, including without limitation the rights
to use, copy, modify, merge, publish, distribute, sublicense, and/or sell
copies of the Software, and to permit persons to whom the Software is furnished
to do so, subject to the following conditions:

The above copyright notice and this permission notice shall be included in all
copies or substantial portions of the Software.

THE SOFTWARE IS PROVIDED "AS IS", WITHOUT WARRANTY OF ANY KIND, EXPRESS OR
IMPLIED, INCLUDING BUT NOT LIMITED TO THE WARRANTIES OF MERCHANTABILITY,
FITNESS FOR A PARTICULAR PURPOSE AND NONINFRINGEMENT. IN NO EVENT SHALL THE
AUTHORS OR COPYRIGHT HOLDERS BE LIABLE FOR ANY CLAIM, DAMAGES OR OTHER
LIABILITY, WHETHER IN AN ACTION OF CONTRACT, TORT OR OTHERWISE, ARISING FROM,
OUT OF OR IN CONNECTION WITH THE SOFTWARE OR THE USE OR OTHER DEALINGS IN THE
SOFTWARE.