The Circles tab allows you to visualize the traffic flows between groups of addresses. For example, grouping end host addresses for each department allows you to view traffic between departments. Understanding network traffic in this way allows you to make accurate capacity planning decisions (eg, do I need to upgrade the link between the the finance and the HR department?) and help enforce usage policies (are unauthorized hosts accessing the admin servers?).
A Circles chart shows the top 100 traffic flows, with the end hosts which are responsible for the top 100 flows displayed as black squares, and clustered together in circles. Lines, colored according to the traffic type, join the end hosts, of a flow. The width of a line is scaled according to the volume of traffic in the flow. The traffic type (or protocol) for each color is shown in the chart legend. The legend entries are ordered left to right, ordered by the volume of each traffic type.
The Circles tab includes a control bar that allows you to select the switch (Section 4.6, “Selecting a switch”)and interface (Section 4.7, “Selecting an interface”) for which you would like to analyze and view traffic data, whether the top flows should be determined by frames or bytes, and whether the clusters and flows should be labelled automatically. You can also select specific time intervals and filter on specific traffic.
![[Note]](images/note.png) |
Note |
|---|---|
|
When you have made changes to the selections for the circles chart, including creating a filter, you can save these selections in a bookmark (see Section 1.4, “Navigating around sFlowTrend-Pro using browser history and bookmarks”) so that you can easily return to the same chart at a later date. |
When end hosts are grouped in clusters, they are displayed as a circle of black squares. You can use the Cluster selector to choose how to cluster the end hosts. Currently, sFlowTrend-Pro supports end host clustering options:
- Subnets
-
The end hosts, which are responsible for the
top 100 flows, are grouped together according
to their subnet.
You must configure sFlowTrend-Pro with the subnets
in your network for the end hosts to be
clustered correctly (see
Section 13.5, “Configuring subnets in sFlowTrend-Pro
 ” ).
Any hosts with IP addresses that are not
contained within the configured subnets will
be displayed in a separate cluster named
External .
If the top flows are for L2 traffic
(for example L2 broadcasts, ARPs or
spanning tree) then the end hosts responsible
for these flows will be grouped in a separate
cluster named Non-IP.
” ).
Any hosts with IP addresses that are not
contained within the configured subnets will
be displayed in a separate cluster named
External .
If the top flows are for L2 traffic
(for example L2 broadcasts, ARPs or
spanning tree) then the end hosts responsible
for these flows will be grouped in a separate
cluster named Non-IP.
- Country
- The end hosts, which are responsible for the top 100 flows, are grouped together according to the country in which the IP addresses of the end hosts are located. A host with an IP address, for which the country cannot be determined, will be displayed in a separate cluster named Unknown. If the top flows are for L2 traffic (for example L2 broadcasts, ARPs or spanning tree) then the end hosts responsible for these flows will be grouped in a separate cluster named Non-IP.
- Switch
- The end hosts, which are responsible for the top 100 flows, are grouped together according to the switch that they are most closely connected to. This allows you to understand traffic that stays within a switch and traffic that crosses multiple switches. A host which cannot be located to a switch, will be displayed in a separate cluster named Unknown.
The Label selector allows you to select how sFlowTrend-Pro should automatically label the elements in the chart. Elements that are automatically labelled will be labelled when the chart is loaded with the latest data. The following options are supported:
- No labels
- Labels will not be displayed automatically, however you can label selected end hosts or clusters by clicking on the corresponding element in the chart (see Section 4.4.2, “Automatically labelling chart elements”).
- Cluster
- Labels are displayed automatically for clusters.
- Top hosts
- Labels are displayed automatically for the end hosts which are responsible for the highest volume of traffic and are responsible for the largest number of flows.
- Clusters and flows
- Labels are displayed automatically for clusters and for the end hosts which are responsible for the highest volume of traffic and are responsible for the largest number of flows.
|
Note |
|---|---|
|
If Resolve IP addresses to hostnames in charts is selected in User preferences (see Section 13.1.2, “Chart settings”), then end host labels will show DNS names for addresses when the addresses can be resolved. |
You can select which traffic volume units are used to determine the top 100 flows that are displayed in the chart. If you change the Units selector to Bits/s then the flows which contributed the highest volume of traffic in bits/s are displayed. If you change the Units selector to Bits/s then the flows which contributed the highest volume of traffic in frames/s are displayed.

The Circles chart gives a graphical representation of the top 100 flows during the selected time period. The Time selector allows you to select the time period for which data is to be displayed.
For the Circles charts a time interval selection is defined by a start and end time. The Time selector includes the following, commonly used, time interval selections:
- Last 5 mins
- Last 10 mins
- Last 15 mins
- Last 30 mins
- Last hour
- Custom
The Custom option Gives full flexibility in accessing the stored historical data. Set the desired start and end times for the interval, then click the button to cause the chart for the selected interval to be displayed.
When a non-custom time period is selected, the displayed chart will be automatically updated when the next data point is available, thus displaying a rolling window of data.
The Time selector also includes back
 and forward
 buttons that can be used to view data for the previous or
next time interval. For example if the time selection is
Last 5 mins
and the current time is Mon 21 Dec, 2015 11:44, clicking on
the back arrow will cause the previous 5 minutes of data,
ending at Mon 21 Dec 2015, 11:39, to be displayed (using the
Custom
time selection). The back and forward buttons will be
inactive if the current time selection is at the beginning
or the end of the stored data.
buttons that can be used to view data for the previous or
next time interval. For example if the time selection is
Last 5 mins
and the current time is Mon 21 Dec, 2015 11:44, clicking on
the back arrow will cause the previous 5 minutes of data,
ending at Mon 21 Dec 2015, 11:39, to be displayed (using the
Custom
time selection). The back and forward buttons will be
inactive if the current time selection is at the beginning
or the end of the stored data.
|
Note |
|---|---|
|
sFlowTrend-Pro interprets the selected time period in the server time zone. Similarly, The resulting chart title displays the time period in the server time zone. |
In addition to automatically labelling chart elements, you can
selectively label chart elements by clicking on the element of
interest. To show a label for an end host, click on the black
square for the end host; to show a label for a cluster, click on
the white square in the centre of the circles, to label a flow
click on a line. To remove a label, click on
 in the top right corner of the label.
You can find out more information about an end host by first
clicking on the black square for the end host to display the
label, then click on
 .
This will open the Lookup host dialog
using the end host address. If the Lookup host
dialog is already open, then the dialog will be changed to show
information for the newly selected host. See
Chapter 12, End host information for more information.
.
This will open the Lookup host dialog
using the end host address. If the Lookup host
dialog is already open, then the dialog will be changed to show
information for the newly selected host. See
Chapter 12, End host information for more information.
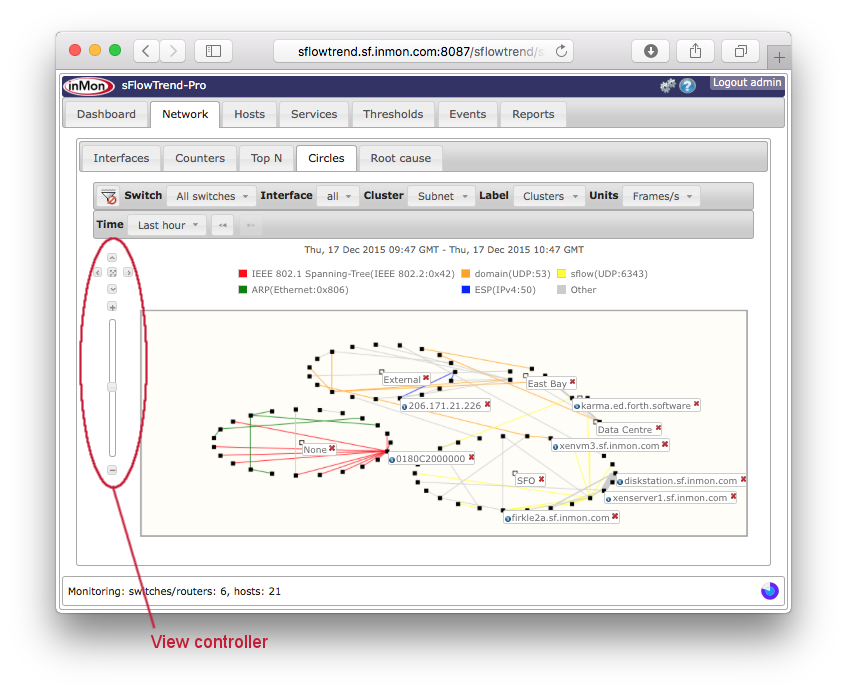
The chart includes a view controller that allows you to zoom in and out; pan left, right, up, and down; and reset the chart to fit in the window. In addition you can zoom in and out using the mouse wheel and pan by dragging the mouse with the button held down.
sFlowTrend-Pro allows you to filter the information displayed in the chart. This allows you to focus on traffic that may be of interest.
You can specify a filter using the Filter bar (see Section 11.1, “Basic use of filters”). In addition you can click on a label for an end host or a flow to automatically filter on traffic for the labelled end host or flow. You can also click on the legend entries to filter on traffic for specific protocols.